The legal profession is often perceived as financially rewarding, and data from the Bureau of Labor Statistics (BLS) supports this to a large extent. The national average annual wage for lawyers in the United States is reported to be $135,740. Furthermore, the field is expected to grow, with an 8 percent employment increase projected from 2022 to 2032, which is faster than the average for all occupations.
However, attorney salaries are far from uniform across the nation. A significant disparity exists when comparing different jurisdictions. For instance, in California, the state with the highest average pay for lawyers, the annual salary reaches $201,530. This figure is a substantial $110,000 greater than the average salary in Wyoming, which is at the lower end of the pay scale. Even California is surpassed by the District of Columbia, where lawyers earn an average annual salary of $226,510, making it the highest paying region in the U.S.
Delving deeper, the top five highest-paying states for attorneys are:
- District of Columbia ($226,510)
- California ($201,530)
- Massachusetts ($196,230)
- New York ($188,900)
- Delaware ($176,904)
- Connecticut ($174,520)
Conversely, the five states where attorney salaries are the lowest are:
- Wyoming ($88,570)
- Idaho ($96,810)
- Montana ($98,170)
- Kentucky ($99,840)
- Mississippi ($101,240)
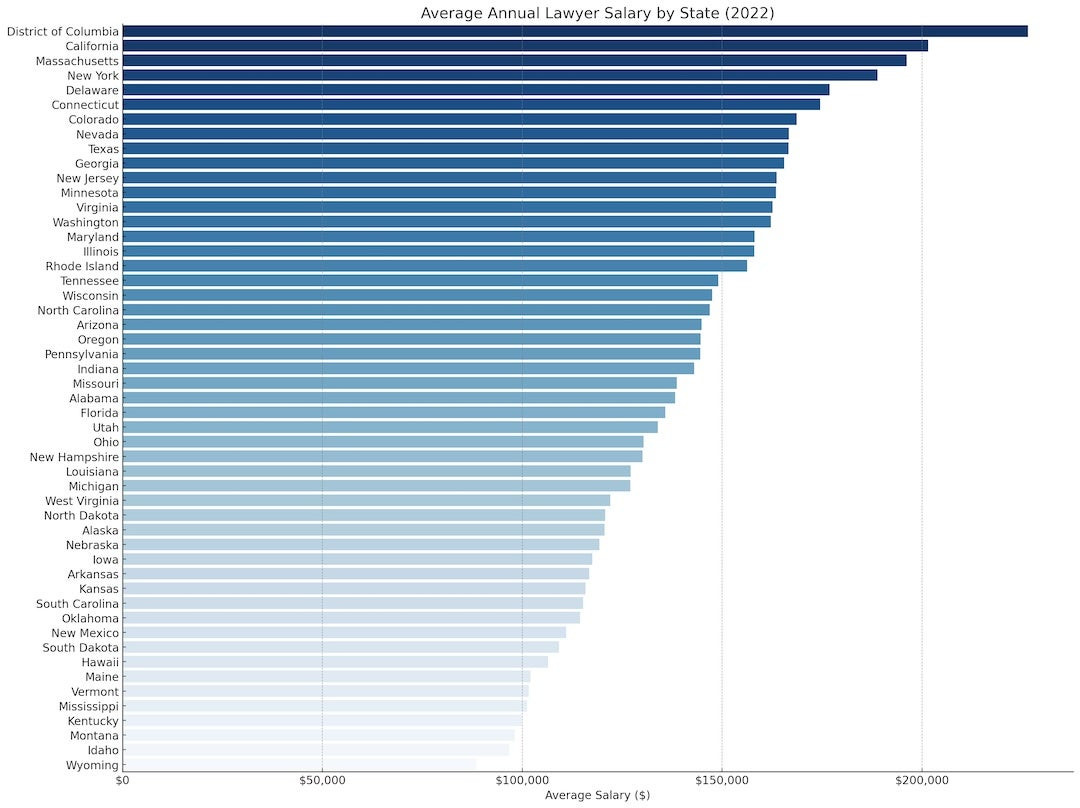 Average Attorney Salary by State in 2022: Map showing lawyer income across the United States, highlighting highest and lowest paying regions.
Looking at salary trends over time reveals further insights. Rhode Island has experienced the most significant increase in average attorney salary over the past decade, with a remarkable growth of 57.86%. Massachusetts follows with a substantial 46.03% increase, and Indiana with 44.17%. Wisconsin (40.40%) and Tennessee (37.70%) also demonstrate strong salary growth for lawyers.
The upward trajectory of attorney salaries in the top 10 highest-paying states over the last decade is visualized below, illustrating the consistent growth in compensation within these leading legal markets.
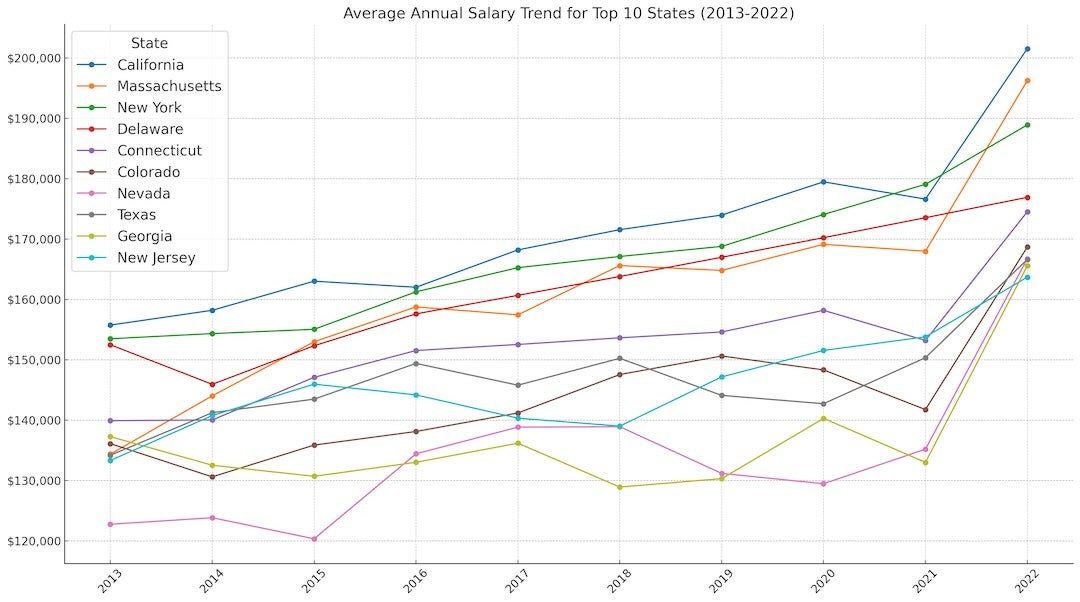 Attorney Salary Growth Trend: Line graph illustrating the increase in average lawyer salaries in the top 10 highest paying states from 2013 to 2022.
For a comprehensive breakdown of attorney salaries across all states and year-over-year comparisons, refer to the detailed table below. Further in-depth salary insights and data categorized by legal roles can be explored on Legal.io’s Salary Insights page.
| Rank | State | 2022 Avg. Salary | 2021 Avg. Salary | 2020 Avg. Salary | 2019 Avg. Salary | 2018 Avg. Salary | 2017 Avg. Salary | 2016 Avg. Salary | 2015 Avg. Salary | 2014 Avg. Salary | 2013 Avg. Salary | 5-Year Change | 10-Year Change |
|---|---|---|---|---|---|---|---|---|---|---|---|---|---|
| 1 | California | $201,530 | $176,610 | $179,470 | $173,970 | $171,550 | $168,200 | $162,010 | $163,020 | $158,200 | $155,750 | 19.82% | 29.39% |
| 2 | Massachusetts | $196,230 | $167,980 | $169,120 | $164,800 | $165,610 | $157,450 | $158,760 | $152,990 | $144,030 | $134,380 | 24.63% | 46.03% |
| 3 | New York | $188,900 | $179,060 | $174,060 | $168,780 | $167,110 | $165,260 | $161,260 | $155,050 | $154,340 | $153,490 | 14.30% | 23.07% |
| 4 | Delaware | $176,904 | $173,531 | $170,223 | $166,978 | $163,795 | $160,673 | $157,610 | $152,330 | $145,940 | $152,490 | 0.00% | 0.00% |
| 5 | Connecticut | $174,520 | $153,200 | $158,190 | $154,610 | $153,640 | $152,540 | $151,540 | $147,100 | $140,040 | $139,920 | 14.41% | 24.73% |
| 6 | Colorado | $168,680 | $141,760 | $148,330 | $150,630 | $147,560 | $141,200 | $138,130 | $135,880 | $130,620 | $136,120 | 19.46% | 23.92% |
| 7 | Nevada | $166,740 | $135,200 | $129,480 | $131,190 | $138,920 | $138,850 | $134,440 | $120,360 | $123,850 | $122,770 | 20.09% | 35.81% |
| 8 | Texas | $166,620 | $150,350 | $142,730 | $144,110 | $150,250 | $145,800 | $149,400 | $143,490 | $141,240 | $134,200 | 14.28% | 24.16% |
| 9 | Georgia | $165,560 | $133,020 | $140,300 | $130,320 | $128,930 | $136,190 | $133,030 | $130,710 | $132,540 | $137,280 | 21.57% | 20.60% |
| 10 | New Jersey | $163,690 | $153,800 | $151,550 | $147,170 | $139,020 | $140,340 | $144,190 | $145,970 | $140,770 | $133,330 | 16.64% | 22.77% |
| 11 | Minnesota | $163,480 | $133,750 | $131,460 | $124,510 | $119,330 | $124,230 | $133,390 | $128,320 | $128,290 | $126,520 | 31.59% | 29.21% |
| 12 | Virginia | $162,640 | $146,140 | $151,970 | $143,220 | $139,180 | $136,790 | $139,050 | $135,180 | $131,320 | $129,800 | 18.90% | 25.30% |
| 13 | Washington | $162,200 | $136,210 | $131,530 | $129,550 | $136,480 | $129,220 | $126,900 | $124,000 | $120,740 | $119,900 | 25.52% | 35.28% |
| 14 | Maryland | $158,150 | $140,450 | $139,610 | $135,500 | $128,340 | $126,480 | $123,220 | $121,530 | $126,060 | $127,040 | 25.04% | 24.49% |
| 15 | Illinois | $158,030 | $148,280 | $153,720 | $157,010 | $152,980 | $140,920 | $129,070 | $125,920 | $124,680 | $132,910 | 12.14% | 18.90% |
| 16 | Rhode Island | $156,300 | $148,770 | $134,370 | $124,600 | $125,330 | $129,410 | $131,430 | $129,100 | $119,010 | $99,010 | 20.78% | 57.86% |
| 17 | Tennessee | $149,050 | $123,180 | $121,790 | $124,370 | $124,470 | $129,830 | $127,700 | $125,530 | $113,580 | $108,240 | 14.80% | 37.70% |
| 18 | Wisconsin | $147,530 | $131,630 | $124,410 | $129,440 | $130,450 | $123,600 | $111,080 | $101,990 | $101,980 | $105,080 | 19.36% | 40.40% |
| 19 | North Carolina | $146,890 | $131,960 | $132,190 | $133,290 | $129,990 | $137,200 | $138,470 | $123,940 | $118,310 | $114,840 | 7.06% | 27.91% |
| 20 | Arizona | $144,890 | $126,600 | $140,520 | $136,170 | $145,750 | $138,680 | $130,630 | $125,660 | $117,380 | $131,200 | 4.48% | 10.43% |
| 21 | Oregon | $144,610 | $139,520 | $128,160 | $116,860 | $119,500 | $117,810 | $114,730 | $117,800 | $114,870 | $111,640 | 22.75% | 29.53% |
| 22 | Pennsylvania | $144,570 | $133,330 | $139,120 | $142,890 | $138,610 | $139,050 | $134,600 | $131,090 | $129,460 | $134,250 | 3.97% | 7.69% |
| 23 | Indiana | $143,060 | $123,370 | $117,820 | $111,790 | $113,360 | $113,850 | $114,270 | $110,240 | $103,010 | $99,230 | 25.66% | 44.17% |
| 24 | Missouri | $138,680 | $126,940 | $111,020 | $109,820 | $113,780 | $115,520 | $116,060 | $114,480 | $121,500 | $116,190 | 20.05% | 19.36% |
| 25 | Alabama | $138,250 | $127,910 | $121,130 | $114,240 | $117,100 | $117,640 | $118,420 | $114,820 | $113,010 | $106,790 | 17.52% | 29.46% |
| 26 | Florida | $135,840 | $129,390 | $139,160 | $130,010 | $128,920 | $127,730 | $131,990 | $128,050 | $122,020 | $123,040 | 6.35% | 10.40% |
| 27 | Utah | $133,920 | $129,090 | $141,460 | $134,770 | $112,380 | $109,280 | $108,670 | $113,550 | $118,910 | $115,930 | 22.55% | 15.52% |
| 28 | Ohio | $130,320 | $122,550 | $128,170 | $124,160 | $121,520 | $113,610 | $113,400 | $113,360 | $113,200 | $108,950 | 14.71% | 19.61% |
| 29 | New Hampshire | $130,130 | $124,230 | $129,590 | $126,220 | $125,890 | $119,650 | $115,410 | $114,470 | $111,050 | $112,710 | 8.76% | 15.46% |
| 30 | Louisiana | $127,150 | $110,340 | $112,190 | $108,070 | $105,490 | $101,170 | $105,740 | $111,240 | $113,830 | $110,760 | 25.68% | 14.80% |
| 31 | Michigan | $127,030 | $121,780 | $119,150 | $116,310 | $110,180 | $112,740 | $110,760 | $110,920 | $116,710 | $114,460 | 12.68% | 10.98% |
| 32 | West Virginia | $122,070 | $107,380 | $109,290 | $102,040 | $98,630 | $95,220 | $100,430 | $98,270 | $94,010 | $90,240 | 28.20% | 35.27% |
| 33 | North Dakota | $120,780 | $107,190 | $113,480 | $113,280 | $107,290 | $97,680 | $102,660 | $101,840 | * | $90,850 | 23.65% | 32.94% |
| 34 | Alaska | $120,590 | $113,910 | $116,440 | $115,260 | $121,680 | $122,870 | $123,770 | $121,910 | $117,910 | $120,500 | -1.86% | 0.07% |
| 35 | Nebraska | $119,310 | $106,560 | $118,070 | $112,860 | $108,170 | $110,950 | $107,590 | $106,460 | $93,820 | $95,220 | 7.53% | 25.30% |
| 36 | Iowa | $117,500 | $117,580 | $122,400 | $119,700 | $112,630 | $113,470 | $108,660 | $106,820 | $106,080 | $106,920 | 3.55% | 9.90% |
| 37 | Arkansas | $116,730 | $107,750 | $94,800 | $94,000 | $98,780 | $99,100 | $103,980 | $100,320 | $100,690 | $101,340 | 17.79% | 15.19% |
| 38 | Kansas | $115,860 | $102,640 | $117,910 | $110,290 | $109,020 | $104,730 | $106,470 | $105,790 | $98,850 | $98,750 | 10.63% | 17.33% |
| 39 | South Carolina | $115,230 | $107,780 | $114,320 | $111,090 | $105,320 | $104,300 | $107,230 | $109,250 | $113,760 | $108,790 | 10.48% | 5.92% |
| 40 | Oklahoma | $114,470 | $105,370 | $122,040 | $116,270 | $118,790 | $115,260 | $123,510 | $116,900 | $112,520 | $101,310 | -0.69% | 12.99% |
| 41 | New Mexico | $110,970 | $116,220 | $107,700 | $103,290 | $105,910 | $99,510 | $97,100 | $91,430 | $96,520 | $98,150 | 11.52% | 13.06% |
| 42 | South Dakota | $109,190 | $100,100 | $111,930 | $112,810 | $109,070 | $100,000 | $101,360 | $96,580 | $98,360 | $99,650 | 9.19% | 9.57% |
| 43 | Hawaii | $106,520 | $102,090 | $114,520 | $109,420 | $111,290 | $113,190 | $106,650 | $104,180 | $105,410 | $108,820 | -5.89% | -2.11% |
| 44 | Maine | $102,060 | $100,890 | $98,980 | $106,350 | $107,120 | $102,040 | $106,270 | $99,260 | $100,720 | $93,940 | 0.02% | 8.64% |
| 45 | Vermont | $101,610 | $94,810 | $100,950 | $104,790 | $107,490 | $105,900 | $103,970 | $106,610 | $101,620 | $98,580 | -4.05% | 3.07% |
| 46 | Mississippi | $101,240 | $97,440 | $93,380 | $95,040 | $97,990 | $106,360 | $114,710 | $103,180 | $99,470 | $92,640 | -4.81% | 9.28% |
| 47 | Kentucky | $99,840 | $96,940 | $105,130 | $102,980 | $100,100 | $95,890 | $93,020 | $93,560 | $92,090 | $90,200 | 4.12% | 10.69% |
| 48 | Montana | $98,170 | $96,200 | $93,220 | $83,030 | $88,600 | $83,150 | $83,330 | $82,070 | $75,720 | $75,360 | 18.06% | 30.27% |
| 49 | Idaho | $96,810 | $99,740 | $108,470 | $105,450 | $99,360 | $98,390 | $91,390 | $96,900 | $100,900 | $105,380 | -1.61% | -8.13% |
| 50 | Wyoming | $88,570 | $92,410 | $102,810 | $100,090 | $105,600 | $98,090 | $112,710 | $102,130 | $103,290 | $89,280 | -9.71% | -0.80% |
Source: Occupational Outlook Handbook published by the Bureau of Labor Statistics.