How Much Money Does Apple Make? Apple, a titan in the tech world, generates substantial revenue through its innovative products and services. This article, brought to you by money-central.com, breaks down Apple’s financial performance, exploring its revenue streams, key products, and regional performance, offering a comprehensive look at its financial prowess, ultimately empowering you with financial insights. We’ll delve into Apple’s key performance indicators (KPIs), financial reports, and overall fiscal health, giving you a clear picture of its earnings and profitability, helping you to improve your personal finance, and reach your financial goals.
1. What is Apple’s Annual Revenue?
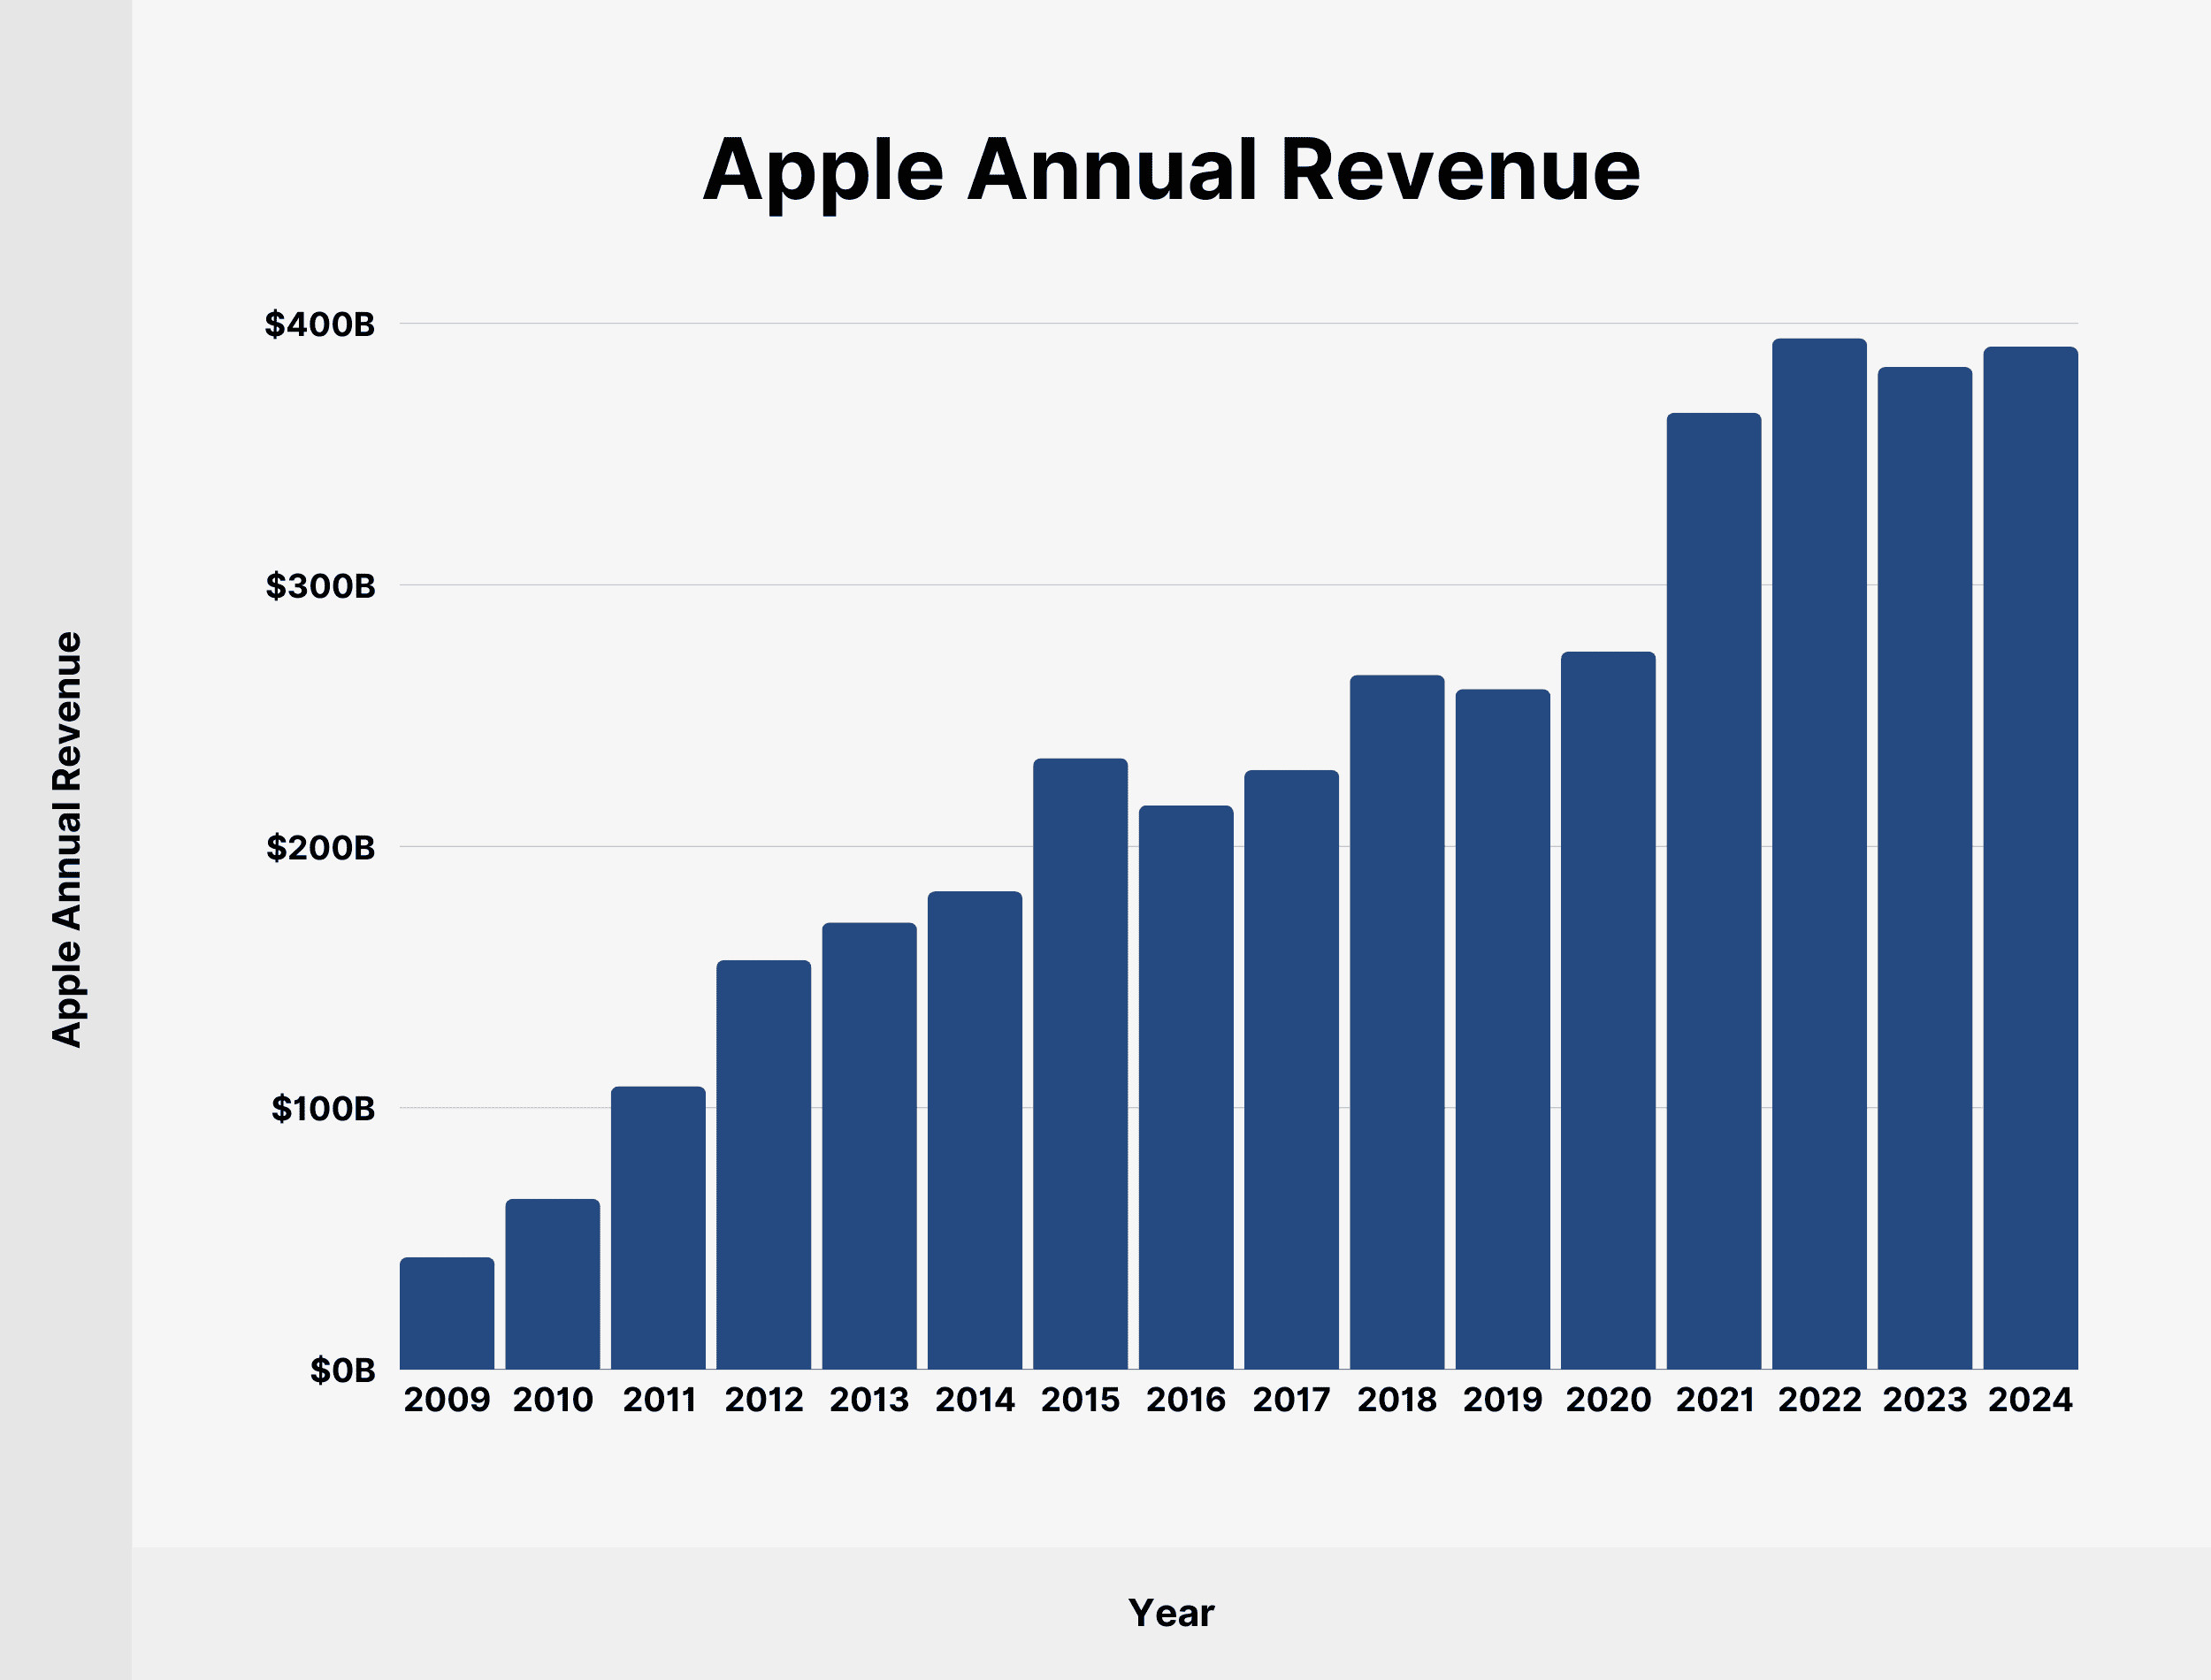
Apple’s annual revenue reached $391.04 billion in 2024. The company’s financial performance is a testament to its global reach and customer loyalty.
Apple’s revenue streams are diverse, including:
- iPhone Sales: iPhones continue to be a major revenue driver for Apple, accounting for a significant portion of its total earnings.
- Services: The services segment, encompassing the App Store, Apple Music, iCloud, and other subscription-based offerings, is a rapidly growing revenue source.
- Mac and iPad: These products maintain a consistent revenue contribution, catering to a broad range of consumers and professionals.
- Wearables, Home, and Accessories: This category includes products like the Apple Watch, AirPods, and HomePod, contributing significantly to overall revenue.
Here’s a table illustrating Apple’s annual revenue since 2009:
| Year | Apple Annual Revenue (USD Billions) |
|---|---|
| 2009 | 42.91 |
| 2010 | 65.23 |
| 2011 | 108.25 |
| 2012 | 156.51 |
| 2013 | 170.91 |
| 2014 | 182.80 |
| 2015 | 233.72 |
| 2016 | 215.64 |
| 2017 | 229.23 |
| 2018 | 265.60 |
| 2019 | 260.17 |
| 2020 | 274.52 |
| 2021 | 365.82 |
| 2022 | 394.33 |
| 2023 | 383.29 |
| 2024 | 391.04 |
 Apple Annual Revenue
Understanding Apple’s revenue trends can provide valuable insights for investors and tech enthusiasts alike. According to research from New York University’s Stern School of Business, in July 2025, Apple’s ability to maintain its revenue growth depends heavily on its capacity to innovate and adapt to changing market dynamics.
2. What is Apple’s Quarterly Revenue?
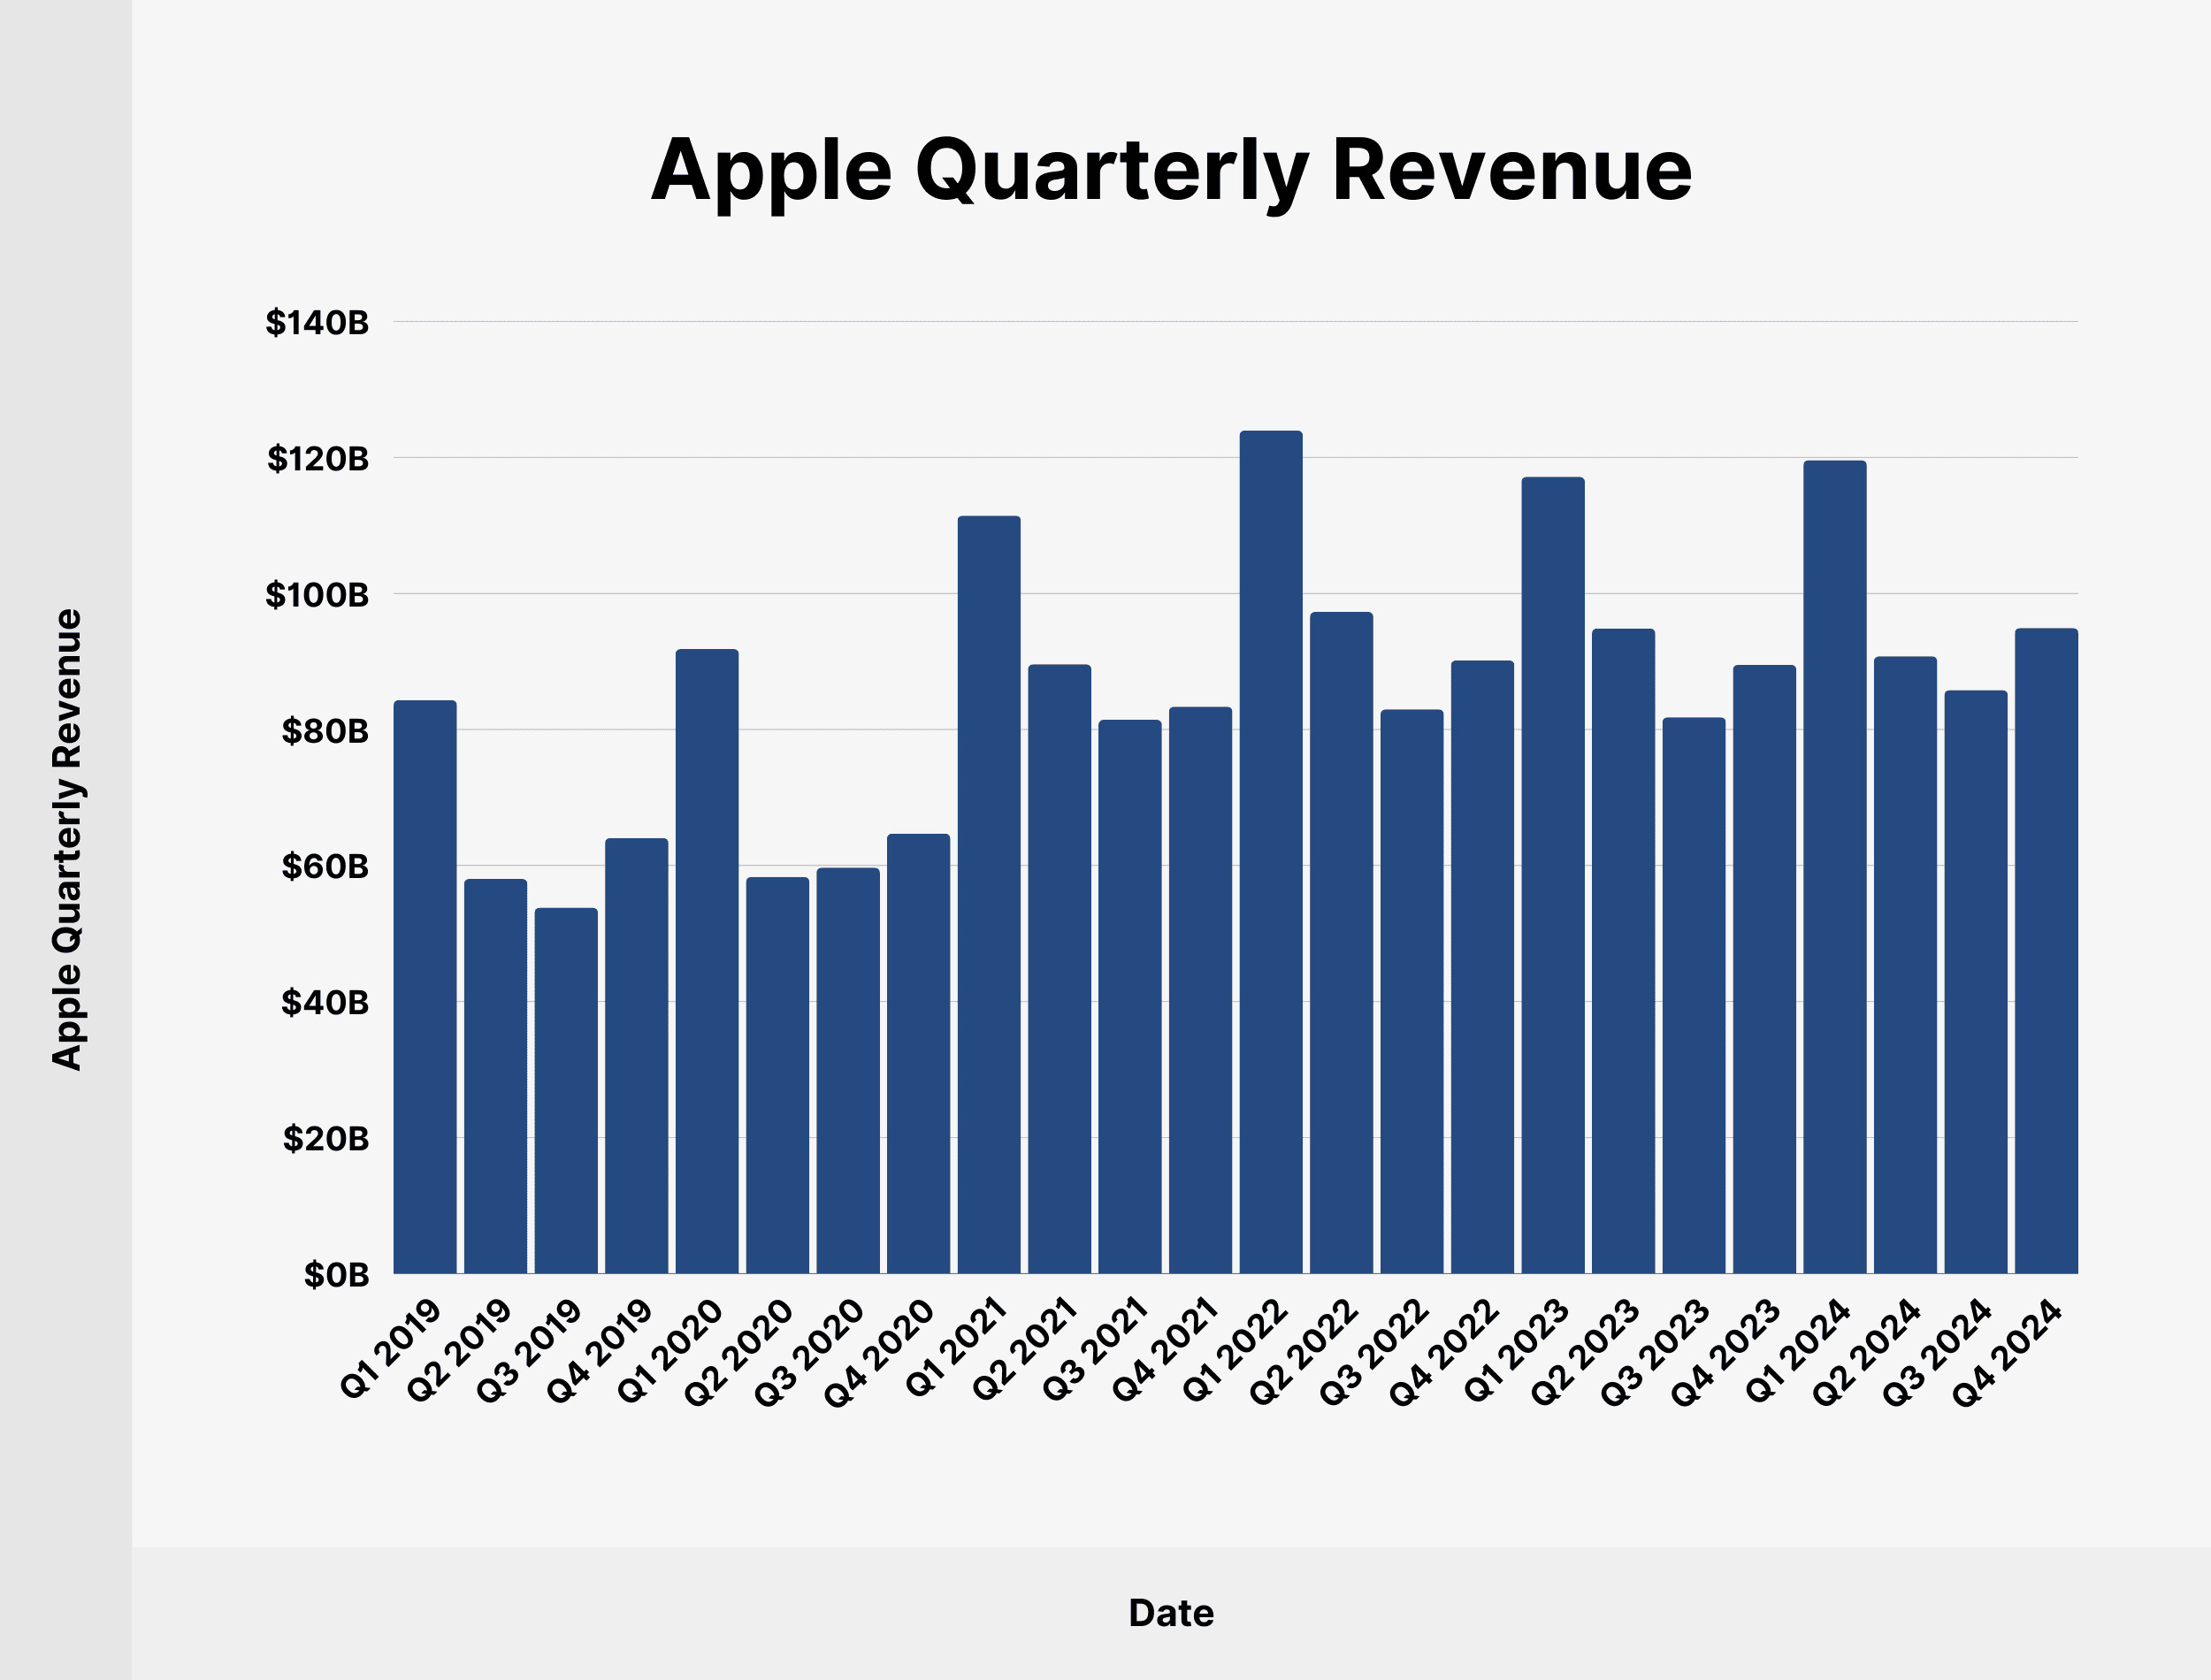
Apple’s quarterly revenue reached $94.93 billion in Q4 2024, demonstrating its sustained market presence.
Apple’s quarterly earnings are influenced by several factors, including:
- Product Launches: New product releases often lead to significant revenue spikes during the launch quarter.
- Seasonal Demand: The holiday season typically results in higher sales, positively impacting Q1 revenue.
- Economic Conditions: Global economic conditions and consumer spending habits can affect Apple’s sales performance.
- Competition: Competitive pressures from other tech companies can influence Apple’s market share and revenue.
Here’s a chart of Apple’s quarterly revenue since Q1 2019:
| Date | Apple Quarterly Revenue (USD Billions) |
|---|---|
| Q1 2019 | 84.31 |
| Q2 2019 | 58.02 |
| Q3 2019 | 53.81 |
| Q4 2019 | 64.04 |
| Q1 2020 | 91.82 |
| Q2 2020 | 58.31 |
| Q3 2020 | 59.69 |
| Q4 2020 | 64.70 |
| Q1 2021 | 111.44 |
| Q2 2021 | 89.58 |
| Q3 2021 | 81.43 |
| Q4 2021 | 83.36 |
| Q1 2022 | 123.95 |
| Q2 2022 | 97.28 |
| Q3 2022 | 82.96 |
| Q4 2022 | 90.15 |
| Q1 2023 | 117.15 |
| Q2 2023 | 94.84 |
| Q3 2023 | 81.80 |
| Q4 2023 | 89.50 |
| Q1 2024 | 119.58 |
| Q2 2024 | 90.75 |
| Q3 2024 | 85.78 |
| Q4 2024 | 94.93 |
 Apple Quarterly Revenue
Staying informed about Apple’s quarterly performance helps in assessing the company’s current financial health and future prospects. Visit money-central.com for more in-depth financial analysis and tools to manage your investments wisely.
3. How Does Apple’s Revenue Break Down by Category?
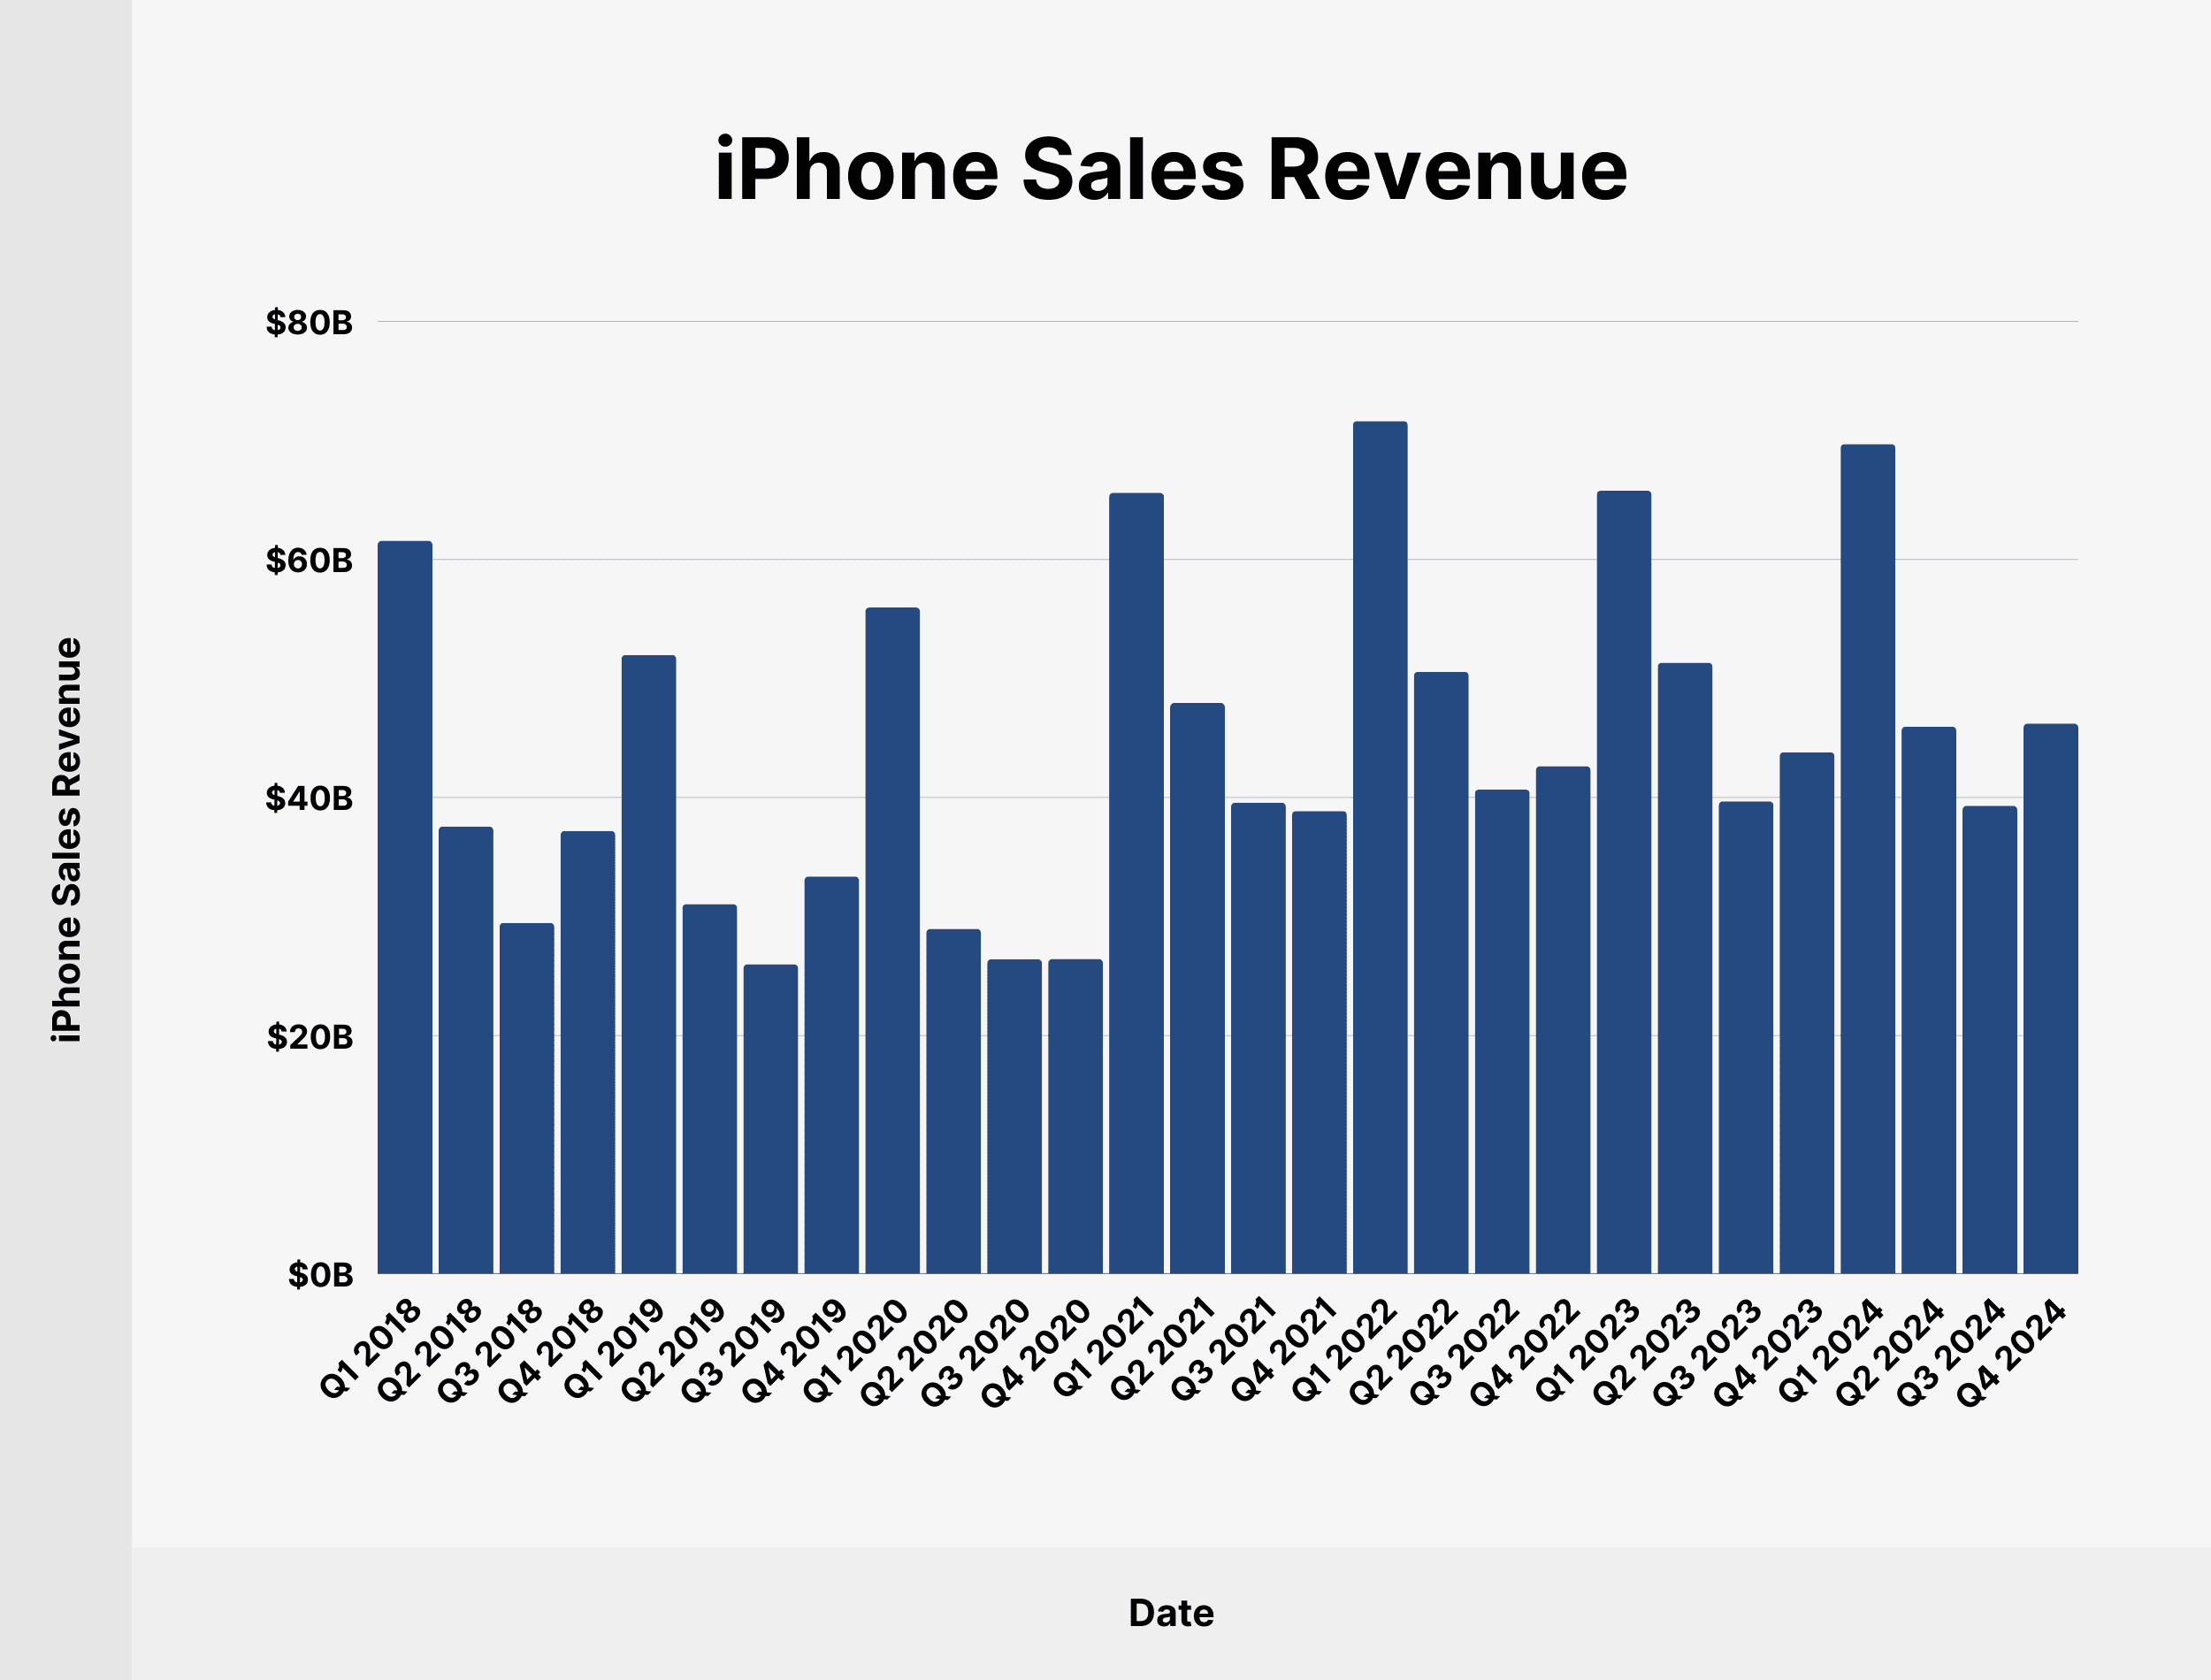
In Q4 2024, iPhone sales led Apple’s revenue categories, accounting for $46.22 billion. Understanding Apple’s revenue distribution across different categories provides insights into its diverse business segments.
The primary revenue categories include:
- iPhone: The flagship product, consistently driving significant revenue.
- Services: A high-margin business that includes the App Store, Apple Music, and iCloud.
- Wearables, Home, and Accessories: A growing category with products like Apple Watch and AirPods.
- Mac: A consistent performer catering to professionals and consumers.
- iPad: A tablet segment that contributes steadily to overall revenue.
Here’s a detailed breakdown of iPhone sales since Q1 2018, including their share of total Apple revenue:
| Date | iPhone Sales (USD Billions) | Share of Total Apple Revenue |
|---|---|---|
| Q1 2018 | 61.58 | 69.74% |
| Q2 2018 | 37.56 | 62.21% |
| Q3 2018 | 29.47 | 56.15% |
| Q4 2018 | 37.19 | 59.12% |
| Q1 2019 | 51.98 | 61.66% |
| Q2 2019 | 31.05 | 53.52% |
| Q3 2019 | 25.99 | 48.29% |
| Q4 2019 | 33.36 | 52.10% |
| Q1 2020 | 55.96 | 60.90% |
| Q2 2020 | 28.96 | 49.70% |
| Q3 2020 | 26.42 | 44.26% |
| Q4 2020 | 26.44 | 40.90% |
| Q1 2021 | 65.60 | 58.86% |
| Q2 2021 | 47.94 | 53.51% |
| Q3 2021 | 39.57 | 48.59% |
| Q4 2021 | 38.87 | 46.63% |
| Q1 2022 | 71.63 | 57.80% |
| Q2 2022 | 50.57 | 51.99% |
| Q3 2022 | 40.67 | 49.02% |
| Q4 2022 | 42.63 | 47.29% |
| Q1 2023 | 65.78 | 56.14% |
| Q2 2023 | 51.33 | 54.13% |
| Q3 2023 | 39.67 | 48.50% |
| Q4 2023 | 43.81 | 48.95% |
| Q1 2024 | 69.70 | 58.29% |
| Q2 2024 | 45.96 | 50.64% |
| Q3 2024 | 39.30 | 45.82% |
| Q4 2024 | 46.22 | 48.69% |
 iPhone Sales Revenue
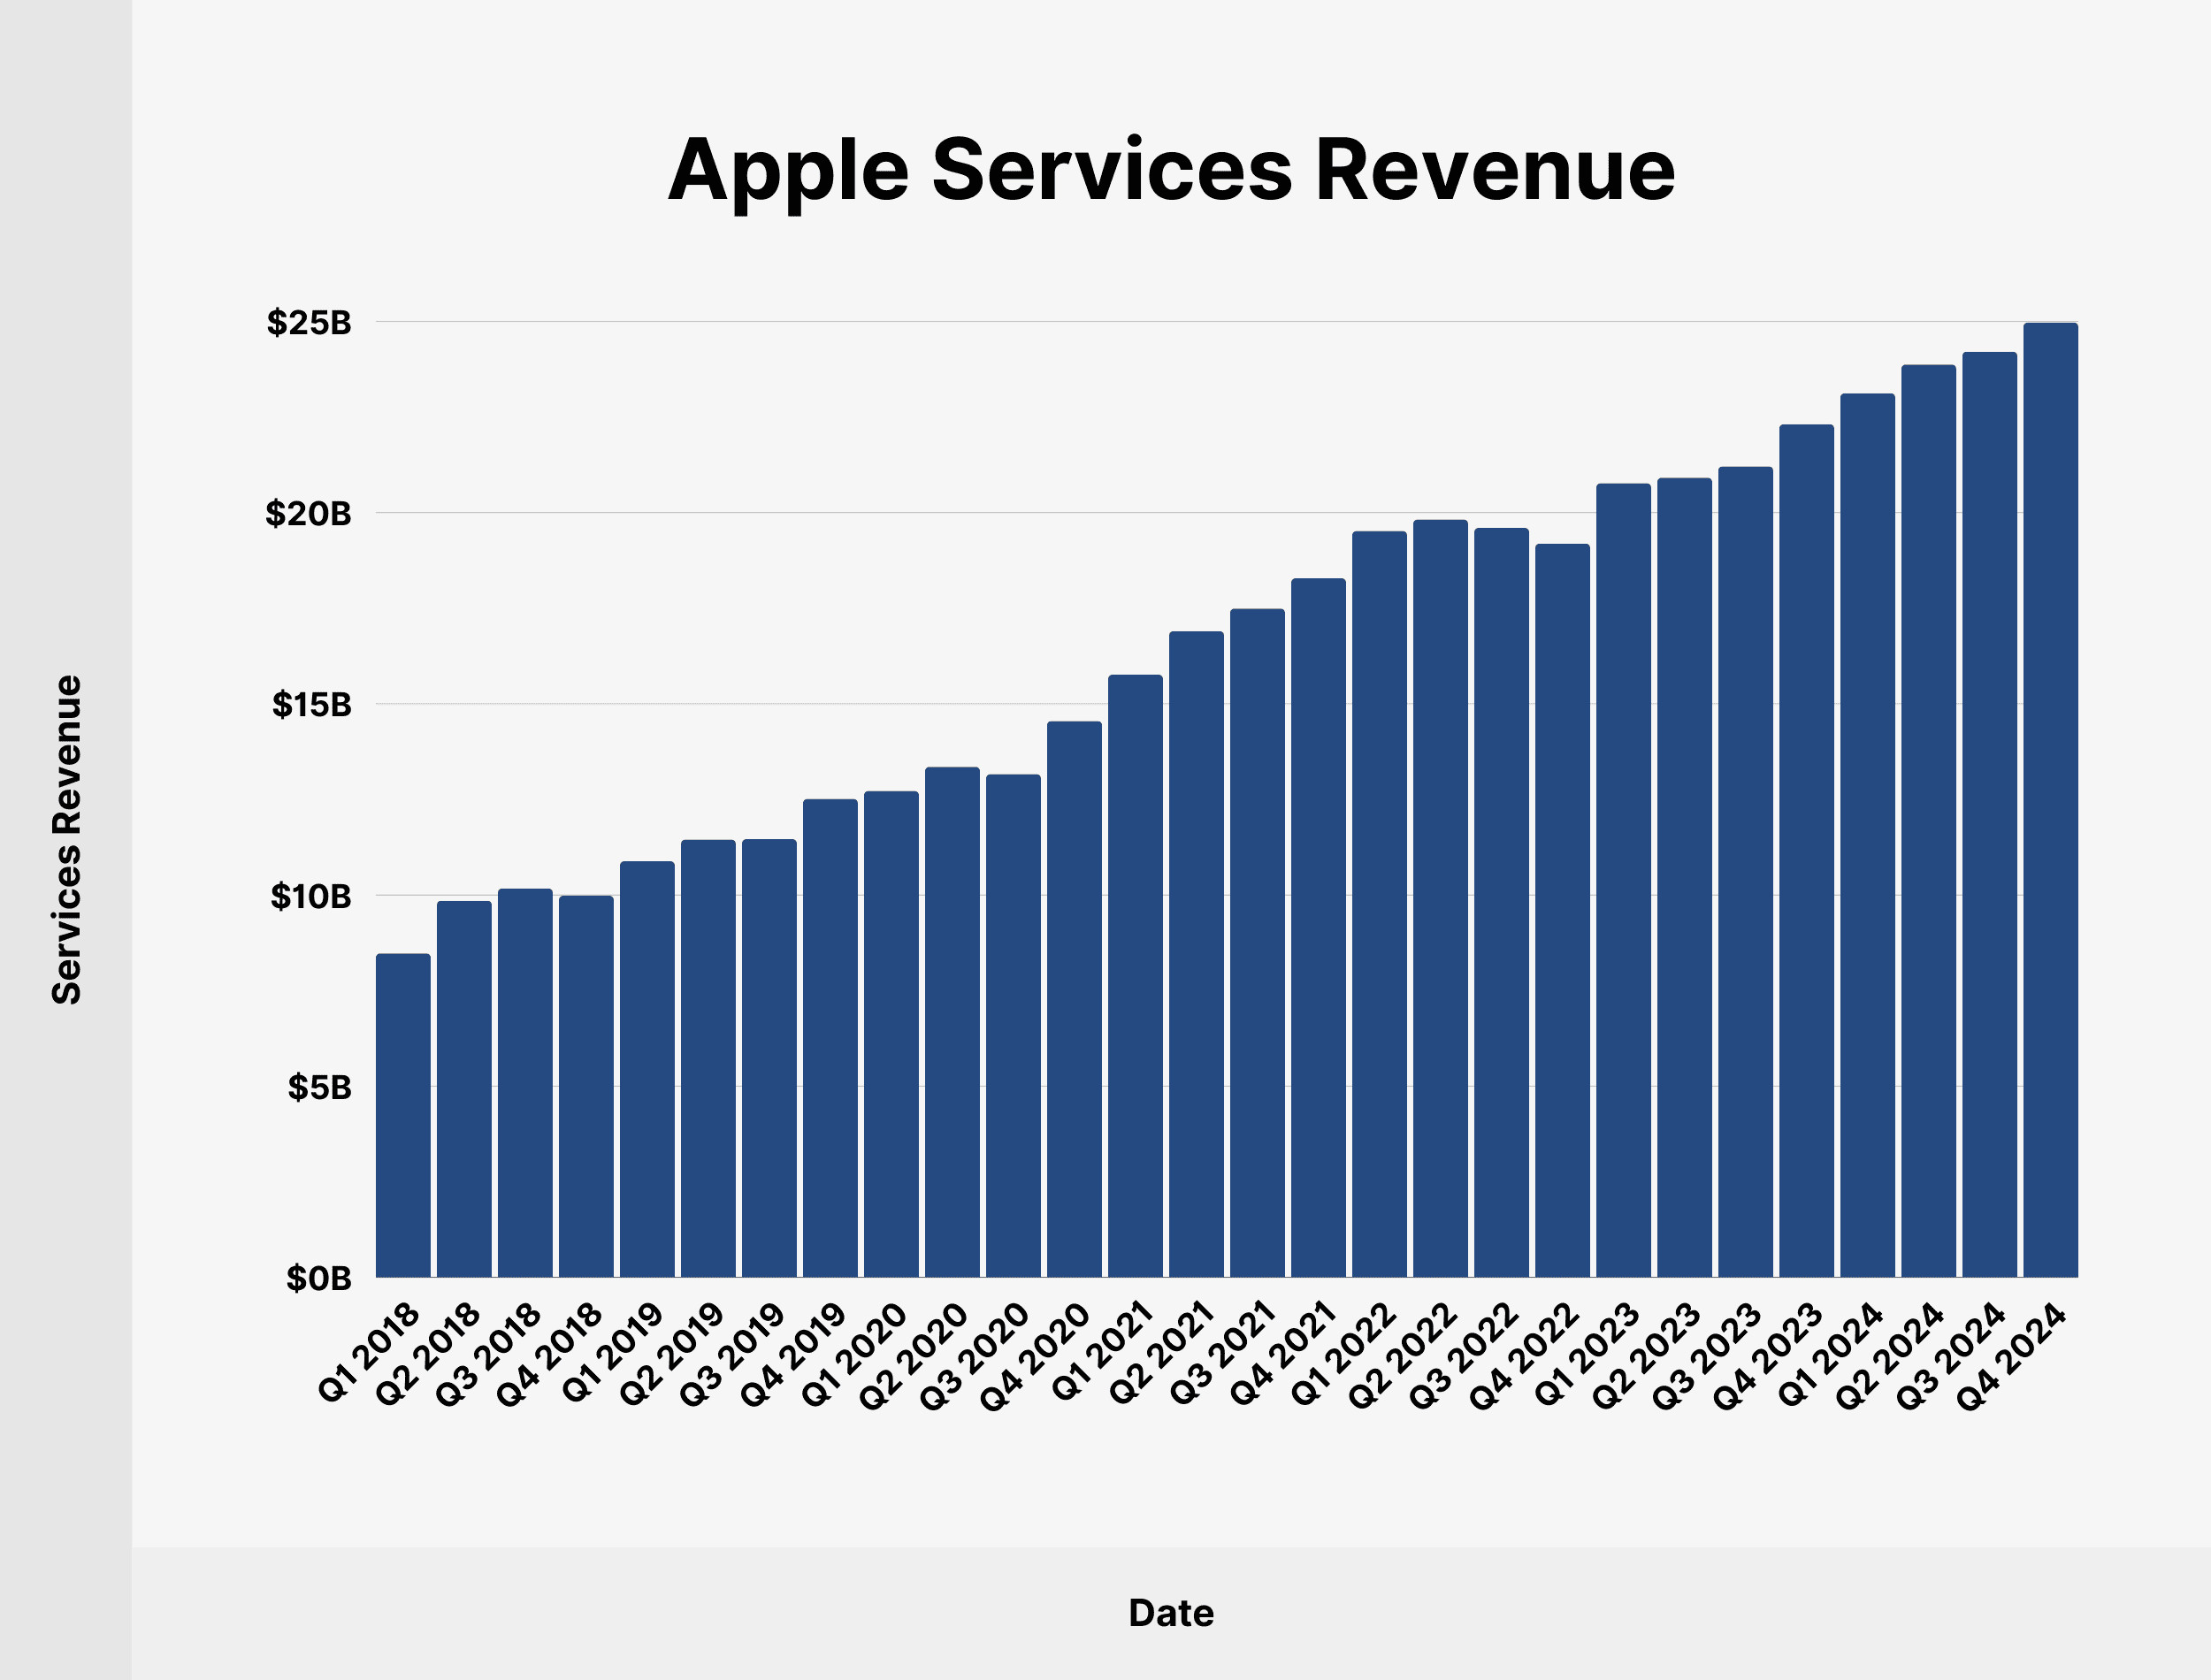
Here’s a table charting Apple’s services revenue since Q1 2018:
| Date | Services Revenue (USD Billions) | Share of Total Apple Revenue |
|---|---|---|
| Q1 2018 | 8.47 | 9.59% |
| Q2 2018 | 9.85 | 15.03% |
| Q3 2018 | 10.17 | 17.93% |
| Q4 2018 | 9.98 | 15.87% |
| Q1 2019 | 10.88 | 12.90% |
| Q2 2019 | 11.45 | 19.74% |
| Q3 2019 | 11.46 | 21.29% |
| Q4 2019 | 12.51 | 19.54% |
| Q1 2020 | 12.72 | 13.85% |
| Q2 2020 | 13.35 | 22.89% |
| Q3 2020 | 13.16 | 22.04% |
| Q4 2020 | 14.55 | 22.50% |
| Q1 2021 | 15.76 | 14.14% |
| Q2 2021 | 16.90 | 18.87% |
| Q3 2021 | 17.49 | 21.47% |
| Q4 2021 | 18.28 | 21.93% |
| Q1 2022 | 19.52 | 15.76% |
| Q2 2022 | 19.82 | 20.37% |
| Q3 2022 | 19.60 | 23.63% |
| Q4 2022 | 19.19 | 21.28% |
| Q1 2023 | 20.77 | 17.73% |
| Q2 2023 | 20.91 | 22.05% |
| Q3 2023 | 21.21 | 25.93% |
| Q4 2023 | 22.31 | 24.93% |
| Q1 2024 | 23.12 | 19.33% |
| Q2 2024 | 23.87 | 26.30% |
| Q3 2024 | 24.21 | 28.23% |
| Q4 2024 | 24.97 | 26.31% |
 Apple Services Revenue
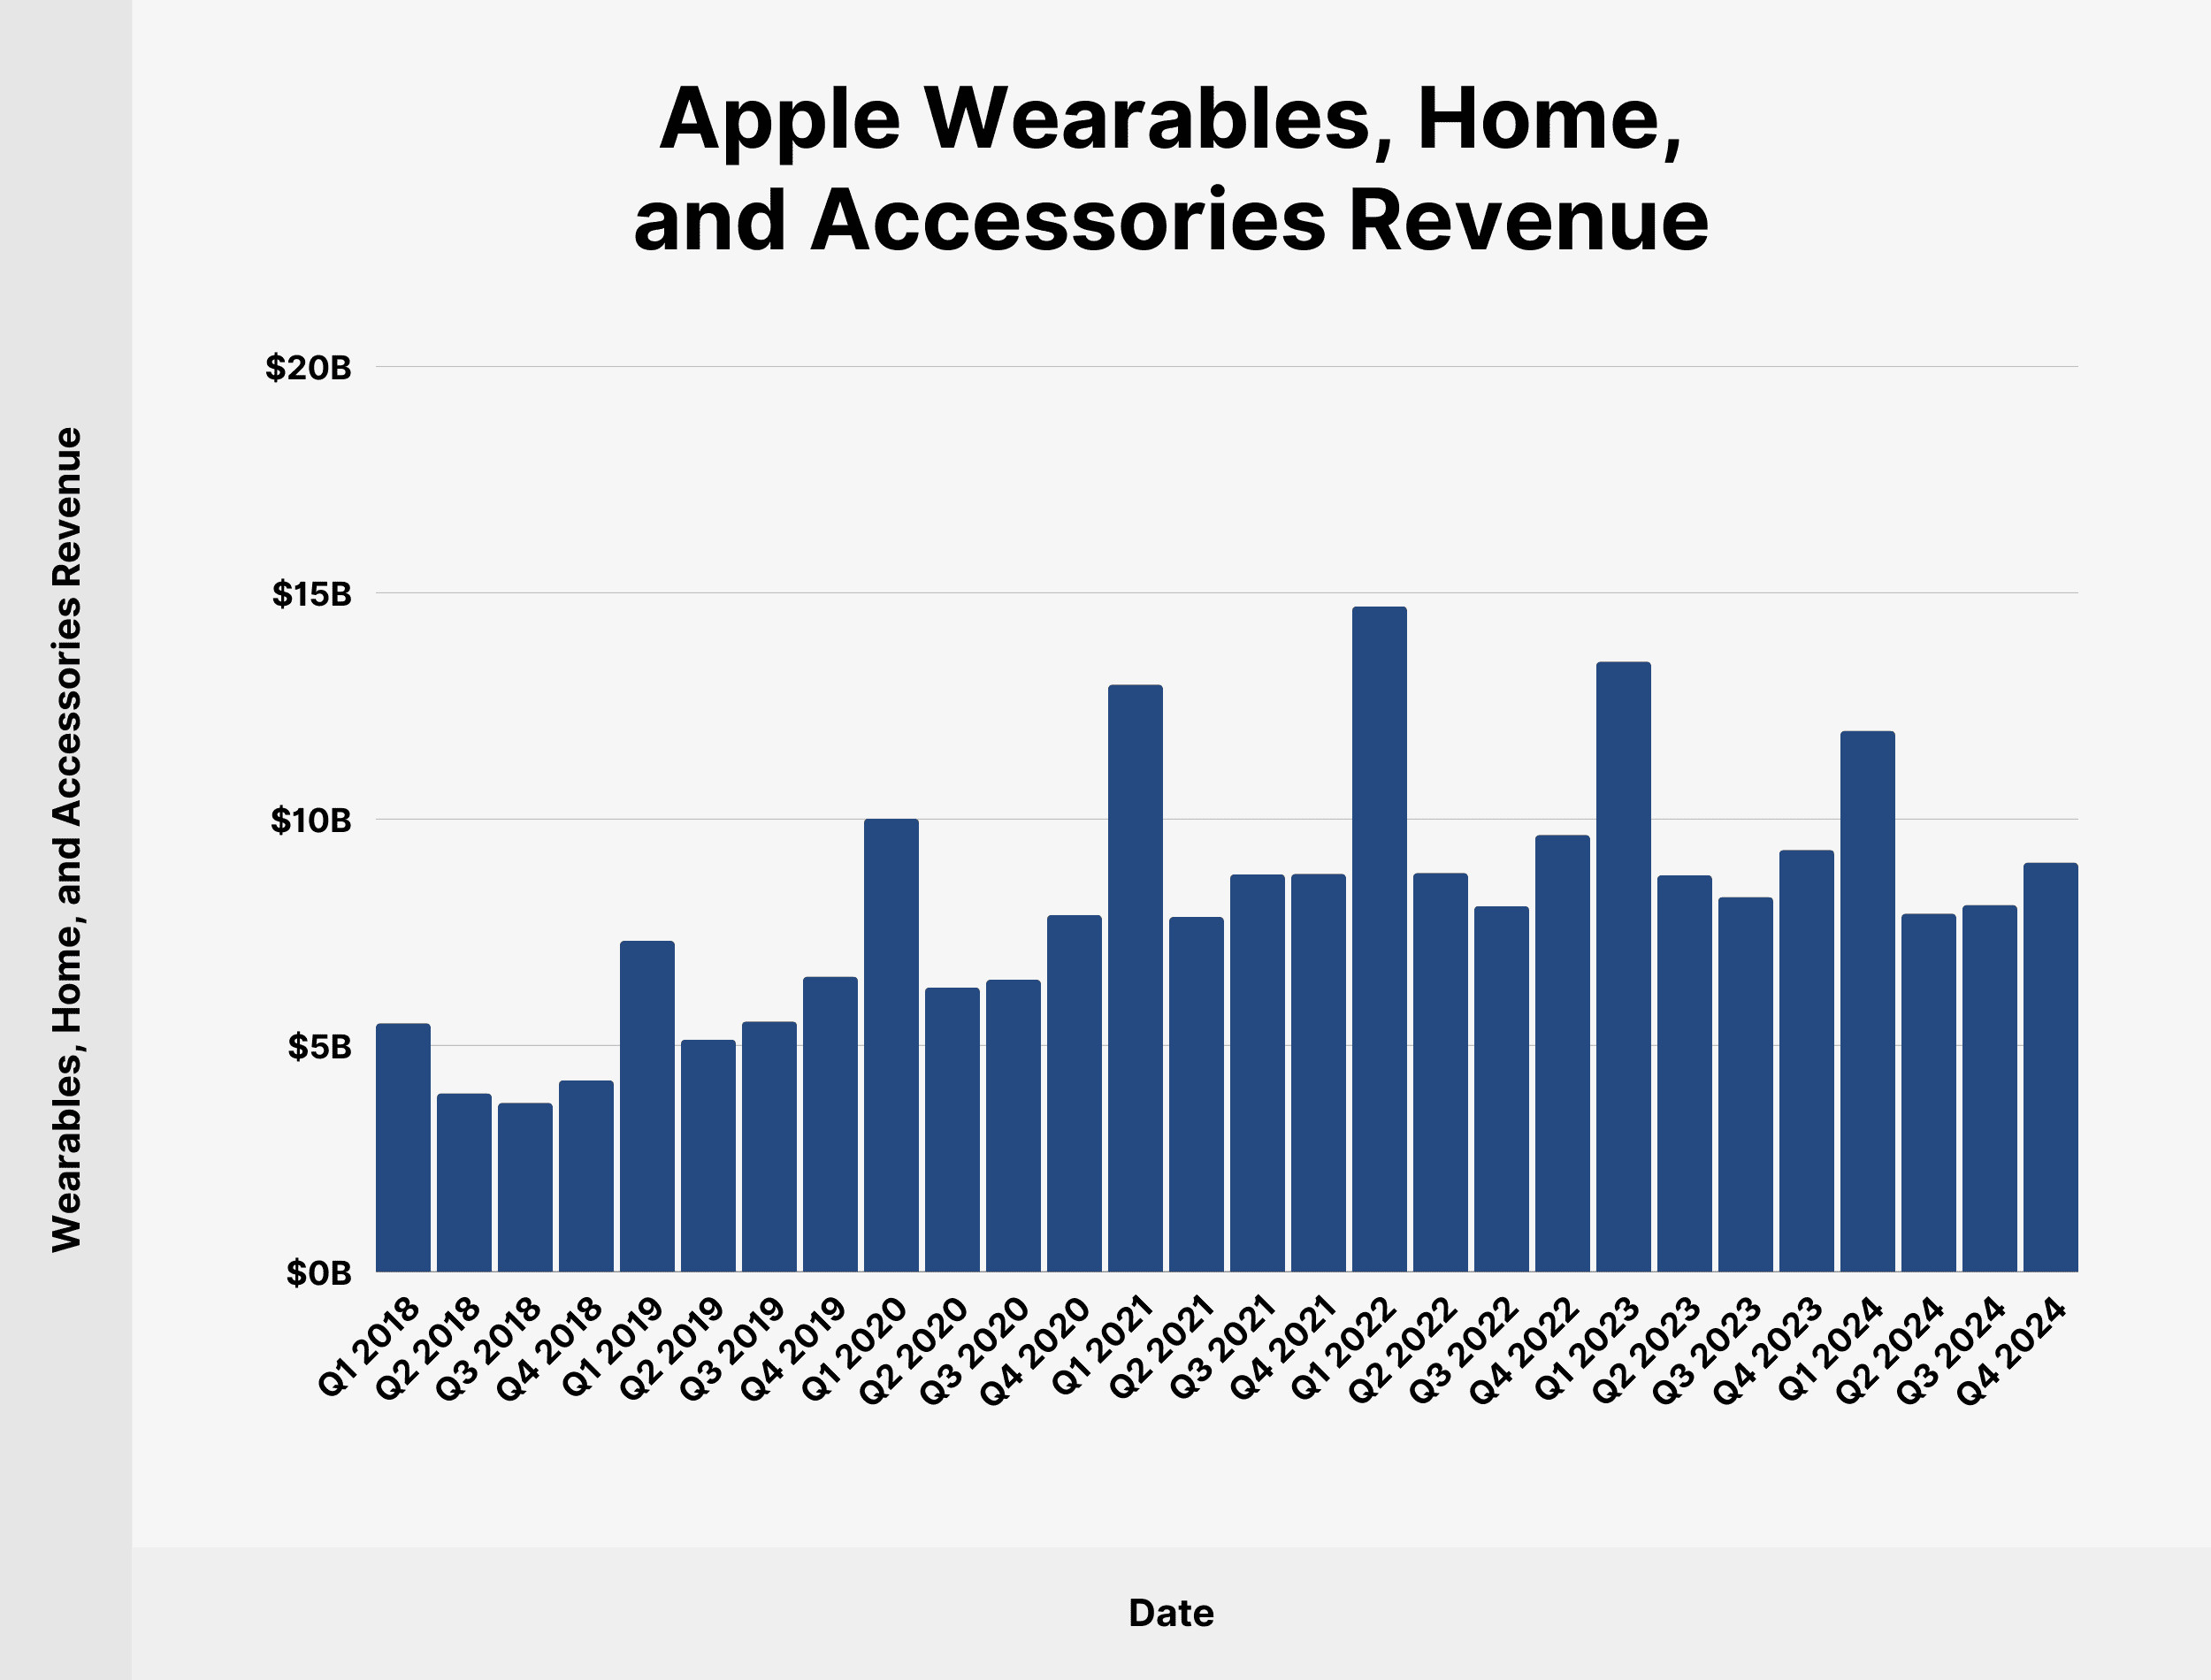
Apple wearables, home, and accessories revenue amounted to $9.04 billion in Q4 2024, accounting for 9.52% of total revenue.
Here’s a detailed breakdown of Apple wearables, home, and accessories revenue since Q1 2018:
| Date | Wearables, Home, and Accessories Revenue (USD Billions) | Share of Total Apple Revenue |
|---|---|---|
| Q1 2018 | 5.49 | 6.22% |
| Q2 2018 | 3.94 | 6.47% |
| Q3 2018 | 3.73 | 7.02% |
| Q4 2018 | 4.23 | 6.70% |
| Q1 2019 | 7.31 | 8.67% |
| Q2 2019 | 5.13 | 8.84% |
| Q3 2019 | 5.53 | 10.27% |
| Q4 2019 | 6.52 | 10.18% |
| Q1 2020 | 10.01 | 10.90% |
| Q2 2020 | 6.28 | 10.78% |
| Q3 2020 | 6.45 | 10.81% |
| Q4 2020 | 7.88 | 12.20% |
| Q1 2021 | 12.97 | 11.64% |
| Q2 2021 | 7.84 | 8.75% |
| Q3 2021 | 8.78 | 10.78% |
| Q4 2021 | 8.79 | 10.54% |
| Q1 2022 | 14.70 | 11.86% |
| Q2 2022 | 8.81 | 9.05% |
| Q3 2022 | 8.08 | 9.74% |
| Q4 2022 | 9.65 | 10.70% |
| Q1 2023 | 13.48 | 11.51% |
| Q2 2023 | 8.76 | 9.23% |
| Q3 2023 | 8.28 | 10.13% |
| Q4 2023 | 9.32 | 10.42% |
| Q1 2024 | 11.95 | 10.00% |
| Q2 2024 | 7.91 | 8.72% |
| Q3 2024 | 8.10 | 9.44% |
| Q4 2024 | 9.04 | 9.52% |
 Apple Wearables, Home, and Accessories Revenue
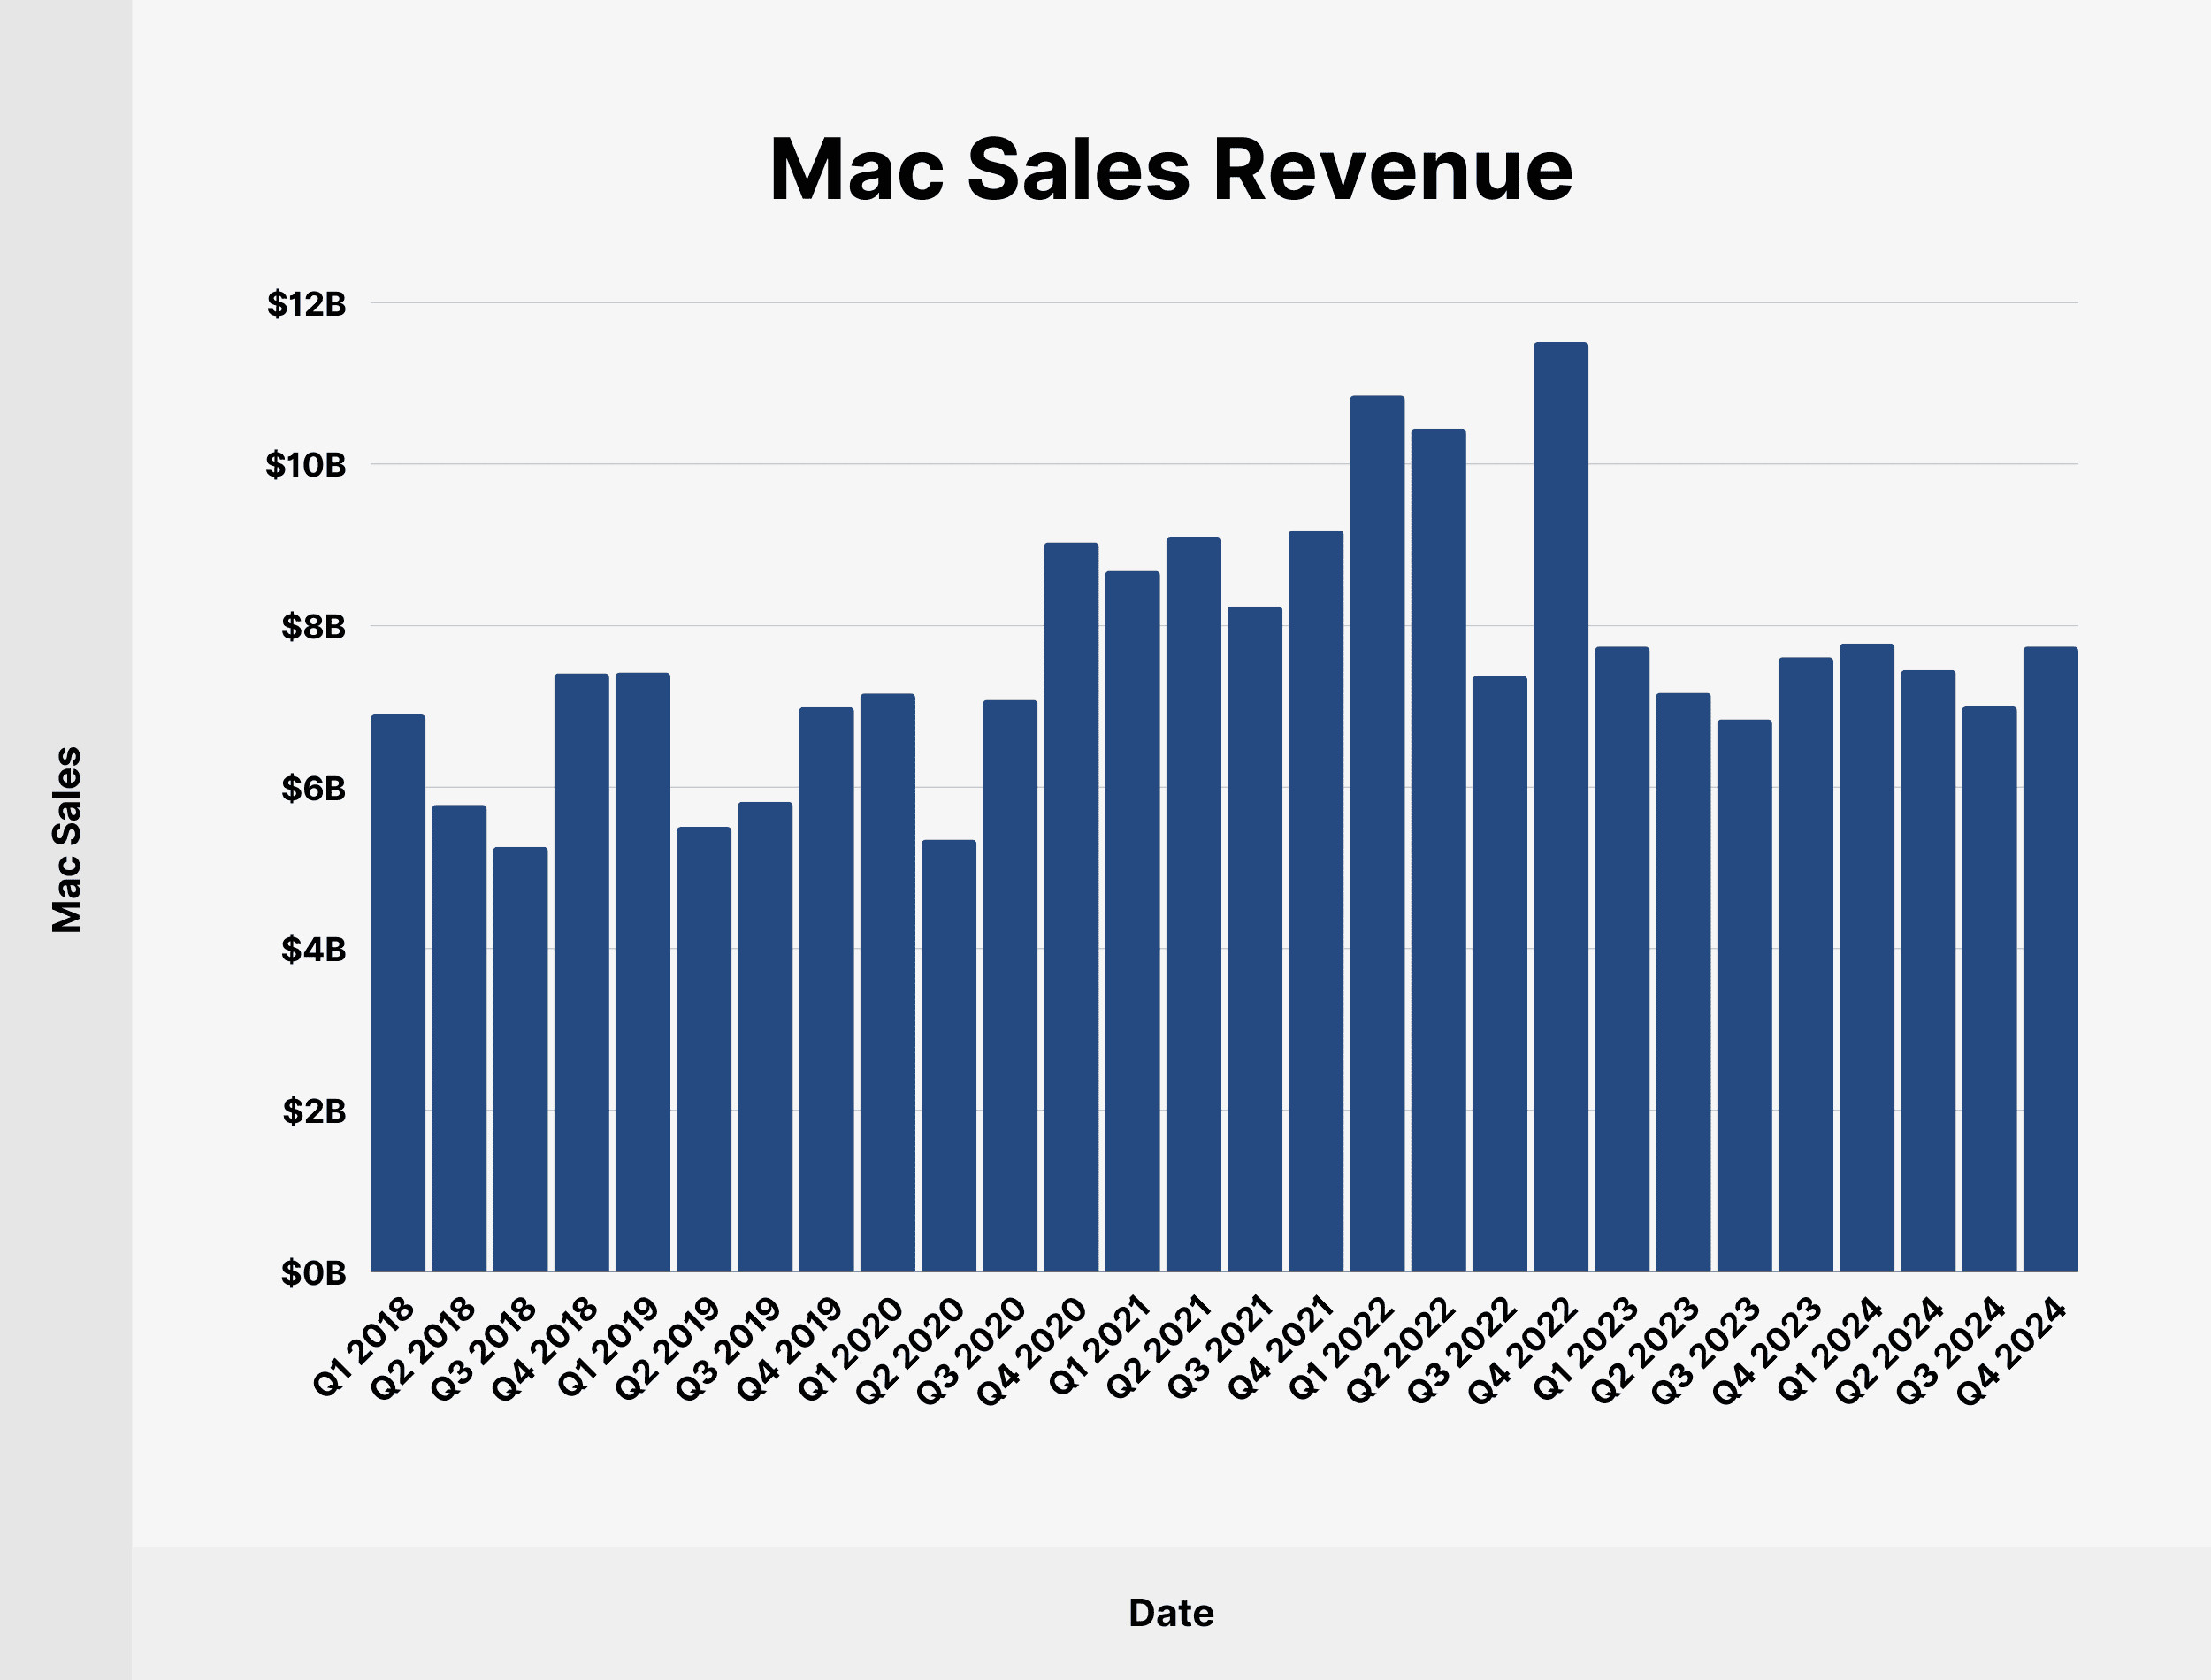
Mac sales reached $7.74 billion in Q4 2024, accounting for 8.15% of Apple’s total quarterly revenue.
Here’s a table with Mac revenue since Q1 2018:
| Date | Mac Sales (USD Billions) | Share of Total Apple Revenue |
|---|---|---|
| Q1 2018 | 6.90 | 7.81% |
| Q2 2018 | 5.78 | 9.57% |
| Q3 2018 | 5.26 | 10.00% |
| Q4 2018 | 7.41 | 11.78% |
| Q1 2019 | 7.42 | 8.80% |
| Q2 2019 | 5.51 | 9.50% |
| Q3 2019 | 5.82 | 10.82% |
| Q4 2019 | 6.99 | 10.92% |
| Q1 2020 | 7.16 | 7.80% |
| Q2 2020 | 5.35 | 9.18% |
| Q3 2020 | 7.08 | 11.86% |
| Q4 2020 | 9.03 | 14.00% |
| Q1 2021 | 8.68 | 7.78% |
| Q2 2021 | 9.10 | 10.16% |
| Q3 2021 | 8.24 | 10.11% |
| Q4 2021 | 9.18 | 11.01% |
| Q1 2022 | 10.85 | 8.76% |
| Q2 2022 | 10.44 | 10.73% |
| Q3 2022 | 7.38 | 8.90% |
| Q4 2022 | 11.51 | 12.77% |
| Q1 2023 | 7.74 | 6.60% |
| Q2 2023 | 7.17 | 7.56% |
| Q3 2023 | 6.84 | 8.36% |
| Q4 2023 | 7.61 | 8.50% |
| Q1 2024 | 7.78 | 6.51% |
| Q2 2024 | 7.45 | 8.21% |
| Q3 2024 | 7.00 | 8.16% |
| Q4 2024 | 7.74 | 8.15% |
 Mac Sales Revenue
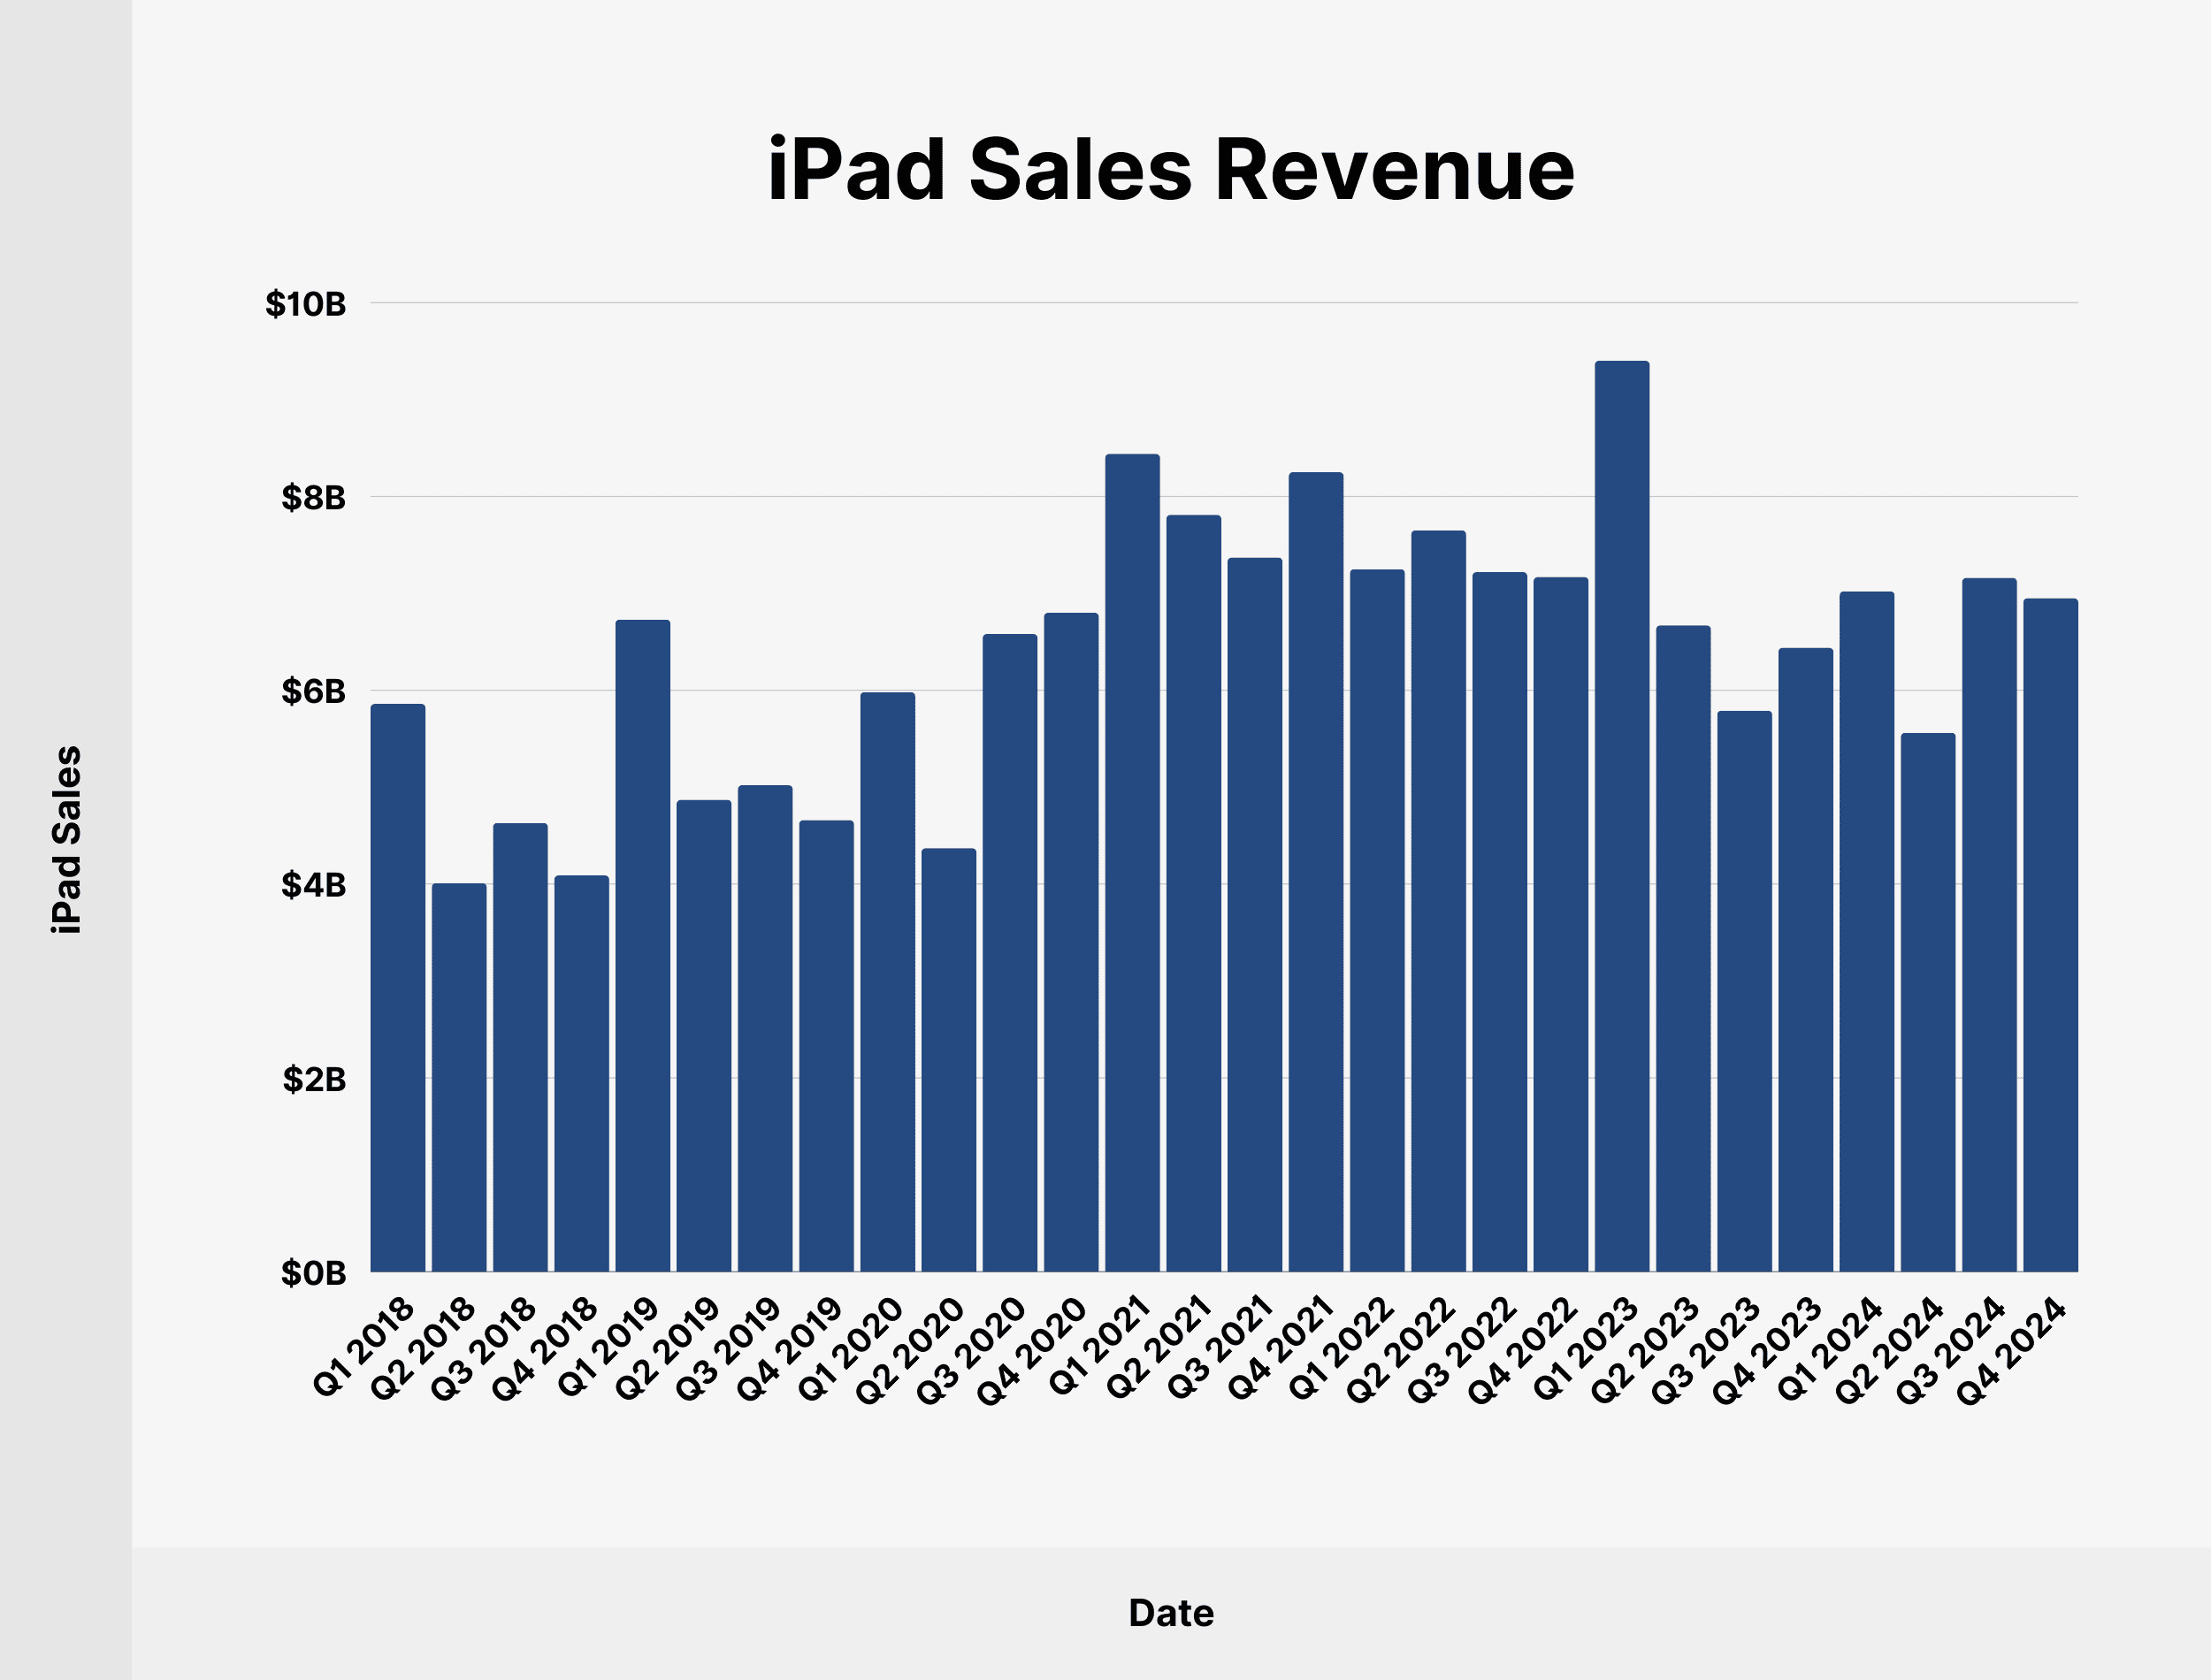
Apple registered $6.95 billion in iPad sales in Q4 2024, accounting for 7.32% of total quarterly revenue.
Here’s a table showing iPad sales since Q1 2018:
| Date | iPad Sales (USD Billions) | Share of Total Apple Revenue |
|---|---|---|
| Q1 2018 | 5.86 | 6.44% |
| Q2 2018 | 4.01 | 6.73% |
| Q3 2018 | 4.63 | 8.90% |
| Q4 2018 | 4.09 | 6.50% |
| Q1 2019 | 6.73 | 7.98% |
| Q2 2019 | 4.87 | 8.40% |
| Q3 2019 | 5.02 | 9.33% |
| Q4 2019 | 4.66 | 7.27% |
| Q1 2020 | 5.98 | 6.51% |
| Q2 2020 | 4.37 | 7.50% |
| Q3 2020 | 6.58 | 11.03% |
| Q4 2020 | 6.80 | 10.05% |
| Q1 2021 | 8.44 | 7.57% |
| Q2 2021 | 7.81 | 8.71% |
| Q3 2021 | 7.37 | 9.05% |
| Q4 2021 | 8.25 | 9.90% |
| Q1 2022 | 7.25 | 5.85% |
| Q2 2022 | 7.65 | 7.86% |
| Q3 2022 | 7.22 | 8.71% |
| Q4 2022 | 7.17 | 7.96% |
| Q1 2023 | 9.40 | 8.02% |
| Q2 2023 | 6.67 | 7.03% |
| Q3 2023 | 5.79 | 7.08% |
| Q4 2023 | 6.44 | 7.20% |
| Q1 2024 | 7.02 | 5.87% |
| Q2 2024 | 5.56 | 6.13% |
| Q3 2024 | 7.16 | 8.35% |
| Q4 2024 | 6.95 | 7.32% |
 iPad Sales Revenue
For more comprehensive financial insights, visit money-central.com.
4. What Are Apple’s Regional Revenue Contributions?
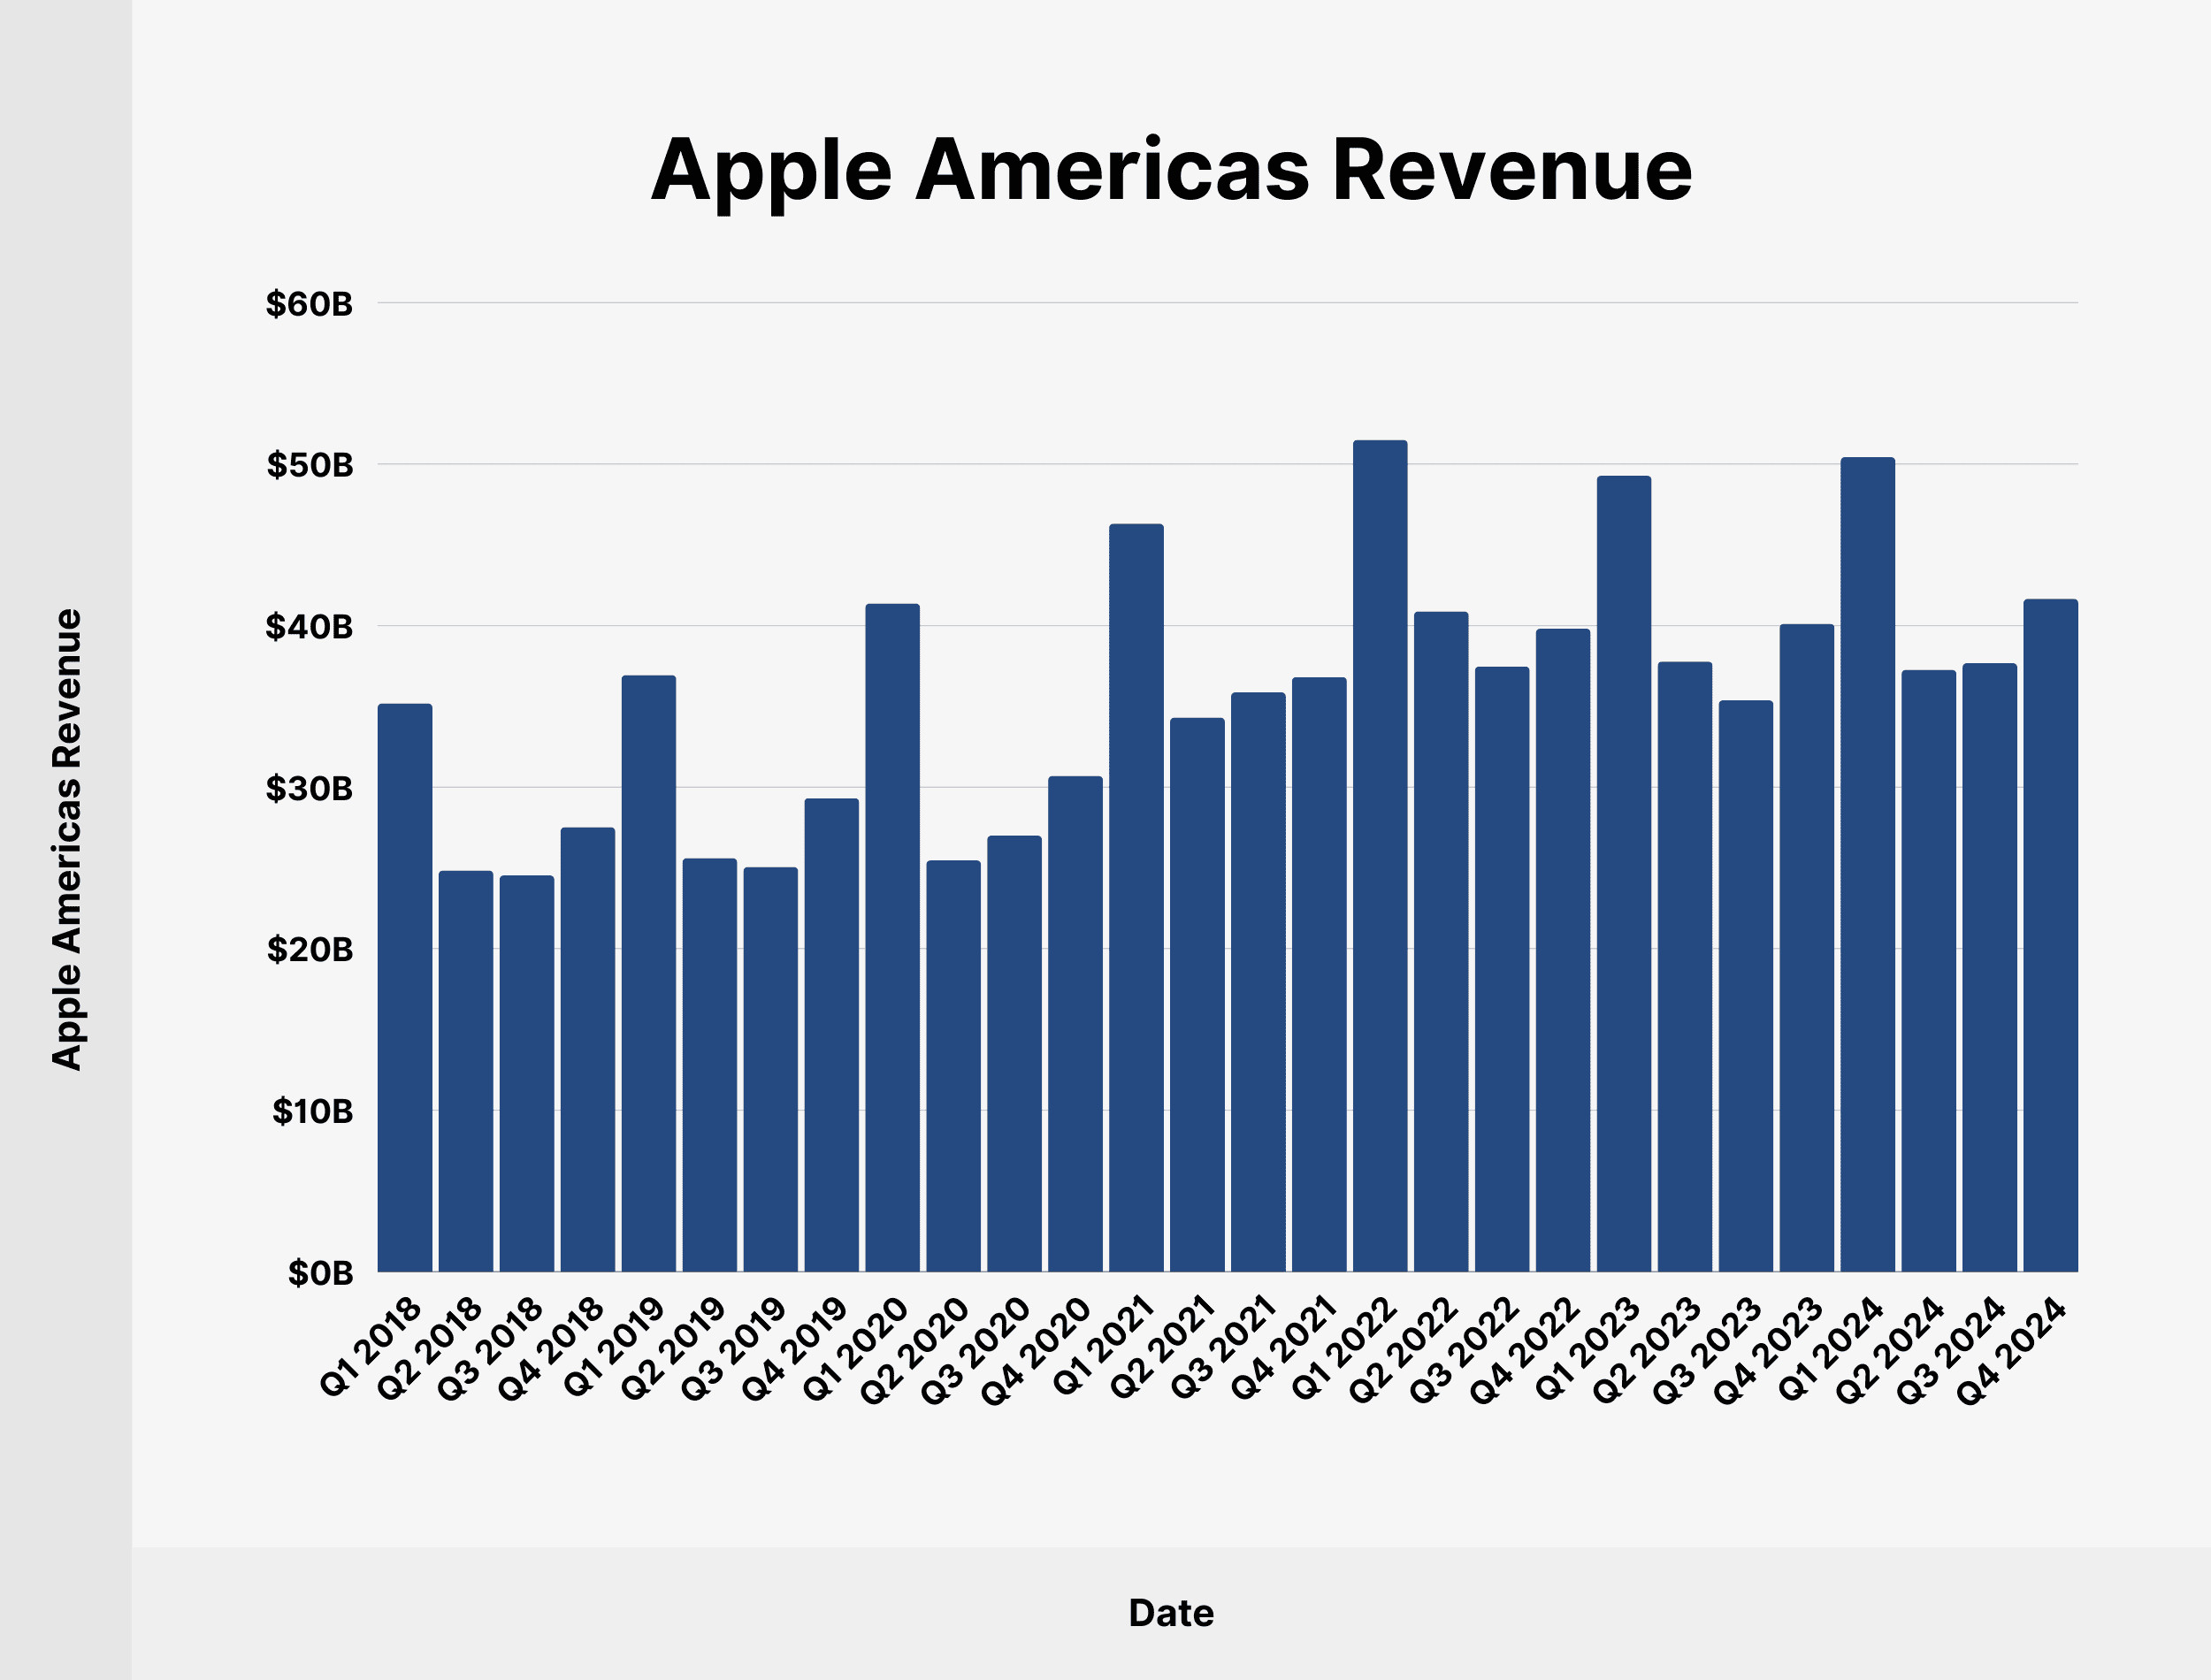
The Americas region contributed $41.66 billion to Apple’s Q4 2024 revenue, making it a key market. A geographic breakdown of Apple’s revenue highlights its global market penetration.
The primary regions include:
- Americas: The largest market, encompassing North and South America.
- Europe: A significant market with a strong customer base.
- Greater China: A critical growth market with increasing consumer demand.
- Japan: A mature market with loyal Apple customers.
- Rest of Asia Pacific: A developing market with substantial growth potential.
Here’s a detailed breakdown of Apple quarterly revenue in the Americas region since Q1 2018, including its share of total revenue:
| Date | Apple Americas Revenue (USD Billions) | Share of Total Apple Revenue |
|---|---|---|
| Q1 2018 | 35.19 | 39.90% |
| Q2 2018 | 24.84 | 40.63% |
| Q3 2018 | 24.54 | 46.08% |
| Q4 2018 | 27.52 | 43.75% |
| Q1 2019 | 36.94 | 43.81% |
| Q2 2019 | 25.60 | 44.12% |
| Q3 2019 | 25.06 | 46.56% |
| Q4 2019 | 29.32 | 45.79% |
| Q1 2020 | 41.37 | 45.05% |
| Q2 2020 | 25.47 | 43.68% |
| Q3 2020 | 27.00 | 45.27% |
| Q4 2020 | 30.70 | 45.40% |
| Q1 2021 | 46.31 | 41.56% |
| Q2 2021 | 34.31 | 38.29% |
| Q3 2021 | 35.87 | 44.04% |
| Q4 2021 | 36.82 | 44.17% |
| Q1 2022 | 51.50 | 41.55% |
| Q2 2022 | 40.88 | 42.03% |
| Q3 2022 | 37.47 | 45.17% |
| Q4 2022 | 39.81 | 44.16% |
| Q1 2023 | 49.28 | 42.06% |
| Q2 2023 | 37.78 | 39.84% |
| Q3 2023 | 35.38 | 43.26% |
| Q4 2023 | 40.12 | 44.82% |
| Q1 2024 | 50.43 | 42.17% |
| Q2 2024 | 37.27 | 41.07% |
| Q3 2024 | 37.68 | 43.93% |
| Q4 2024 | 41.66 | 43.89% |
 Apple Americas Revenue
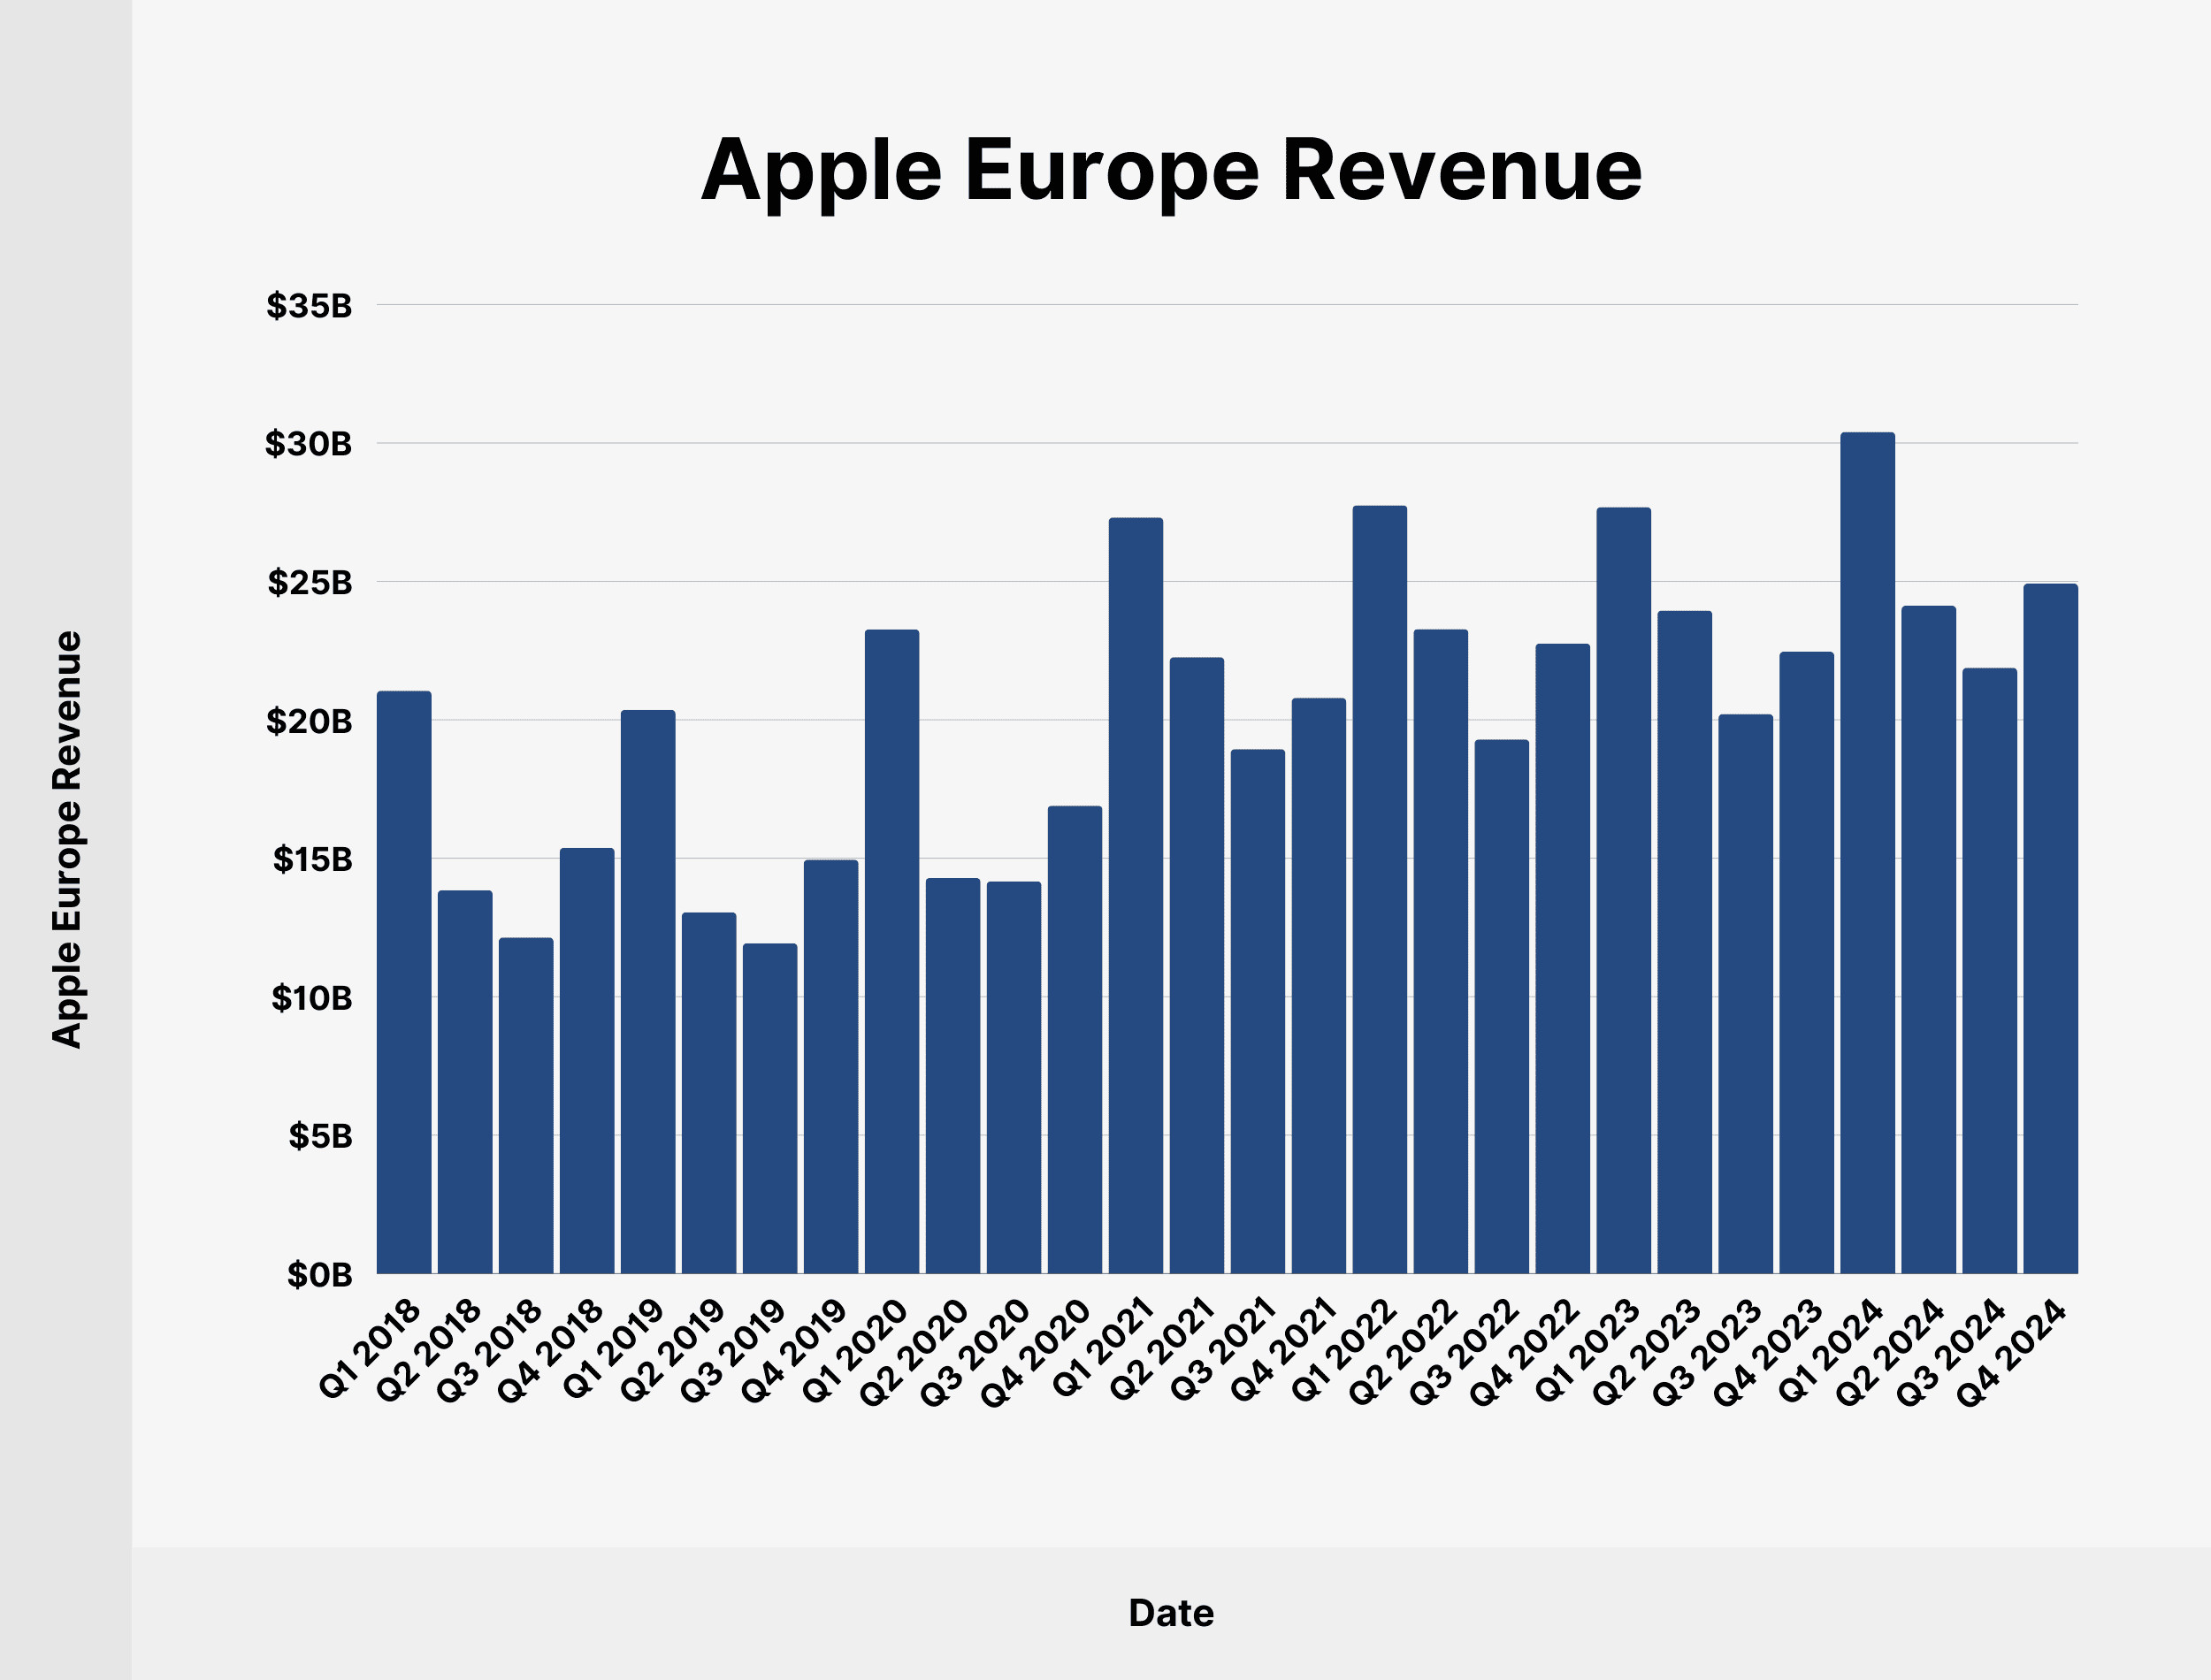
Europe is the second-largest market for Apple. Apple’s revenue in Europe amounted to $24.92 billion in Q4 2024, 26.25% of total quarterly revenue.
Here’s a chart of Apple’s quarterly revenue from the European market since Q1 2018:
| Date | Apple Europe Revenue (USD Billions) | Share of Total Apple Revenue |
|---|---|---|
| Q1 2018 | 21.05 | 23.85% |
| Q2 2018 | 13.85 | 22.65% |
| Q3 2018 | 12.14 | 22.79% |
| Q4 2018 | 15.38 | 24.45% |
| Q1 2019 | 20.36 | 24.15% |
| Q2 2019 | 13.05 | 22.50% |
| Q3 2019 | 11.93 | 22.16% |
| Q4 2019 | 14.95 | 23.34% |
| Q1 2020 | 23.27 | 25.35% |
| Q2 2020 | 14.29 | 24.51% |
| Q3 2020 | 14.17 | 23.75% |
| Q4 2020 | 16.90 | 25.00% |
| Q1 2021 | 27.31 | 24.50% |
| Q2 2021 | 22.26 | 24.85% |
| Q3 2021 | 18.94 | 23.26% |
| Q4 2021 | 20.79 | 24.94% |
| Q1 2022 | 27.75 | 24.00% |
| Q2 2022 | 23.28 | 23.94% |
| Q3 2022 | 19.29 | 23.25% |
| Q4 2022 | 22.76 | 25.29% |
| Q1 2023 | 27.68 | 23.63% |
| Q2 2023 | 23.95 | 25.25% |
| Q3 2023 | 20.21 | 24.70% |
| Q4 2023 | 22.46 | 25.10% |
| Q1 2024 | 30.40 | 25.42% |
| Q2 2024 | 24.12 | 26.58% |
| Q3 2024 | 21.88 | 25.51% |
| Q4 2024 | 24.92 | 26.25% |
 Apple Europe Revenue
The Greater China market accounted for $15.03 billion of Apple’s quarterly revenue in Q4 2024, representing 15.83% of total revenue.
Here’s a table with Apple Greater China revenue since Q1 2018:
| Date | Apple Greater China Revenue (USD Billions) | Share of Total Apple Revenue |
|---|---|---|
| Q1 2018 | 17.96 | 20.34% |
| Q2 2018 | 13.02 | 21.30% |
| Q3 2018 | 9.55 | 17.93% |
| Q4 2018 | 11.41 | 18.14% |
| Q1 2019 | 13.17 | 15.62% |
| Q2 2019 | 10.22 | 17.61% |
| Q3 2019 | 9.16 | 17.02% |
| Q4 2019 | 11.13 | 17.39% |
| Q1 2020 | 13.58 | 14.79% |
| Q2 2020 | 9.46 | 16.21% |
| Q3 2020 | 9.33 | 15.63 |