How Much Money Does Apple Make A Year is a question many investors and tech enthusiasts ponder, and the answer reveals the financial powerhouse that Apple has become. According to recent data compiled by money-central.com, Apple’s annual revenue reached $391.04 billion in 2024, marking them as a global leader in consumer electronics and digital services. Dive into this article to explore Apple’s financial performance, revenue streams, and market dominance in detail, covering key insights into their profitability, including advertising revenue, music subscriber base, and active device statistics.
1. What is Apple’s Annual Revenue?
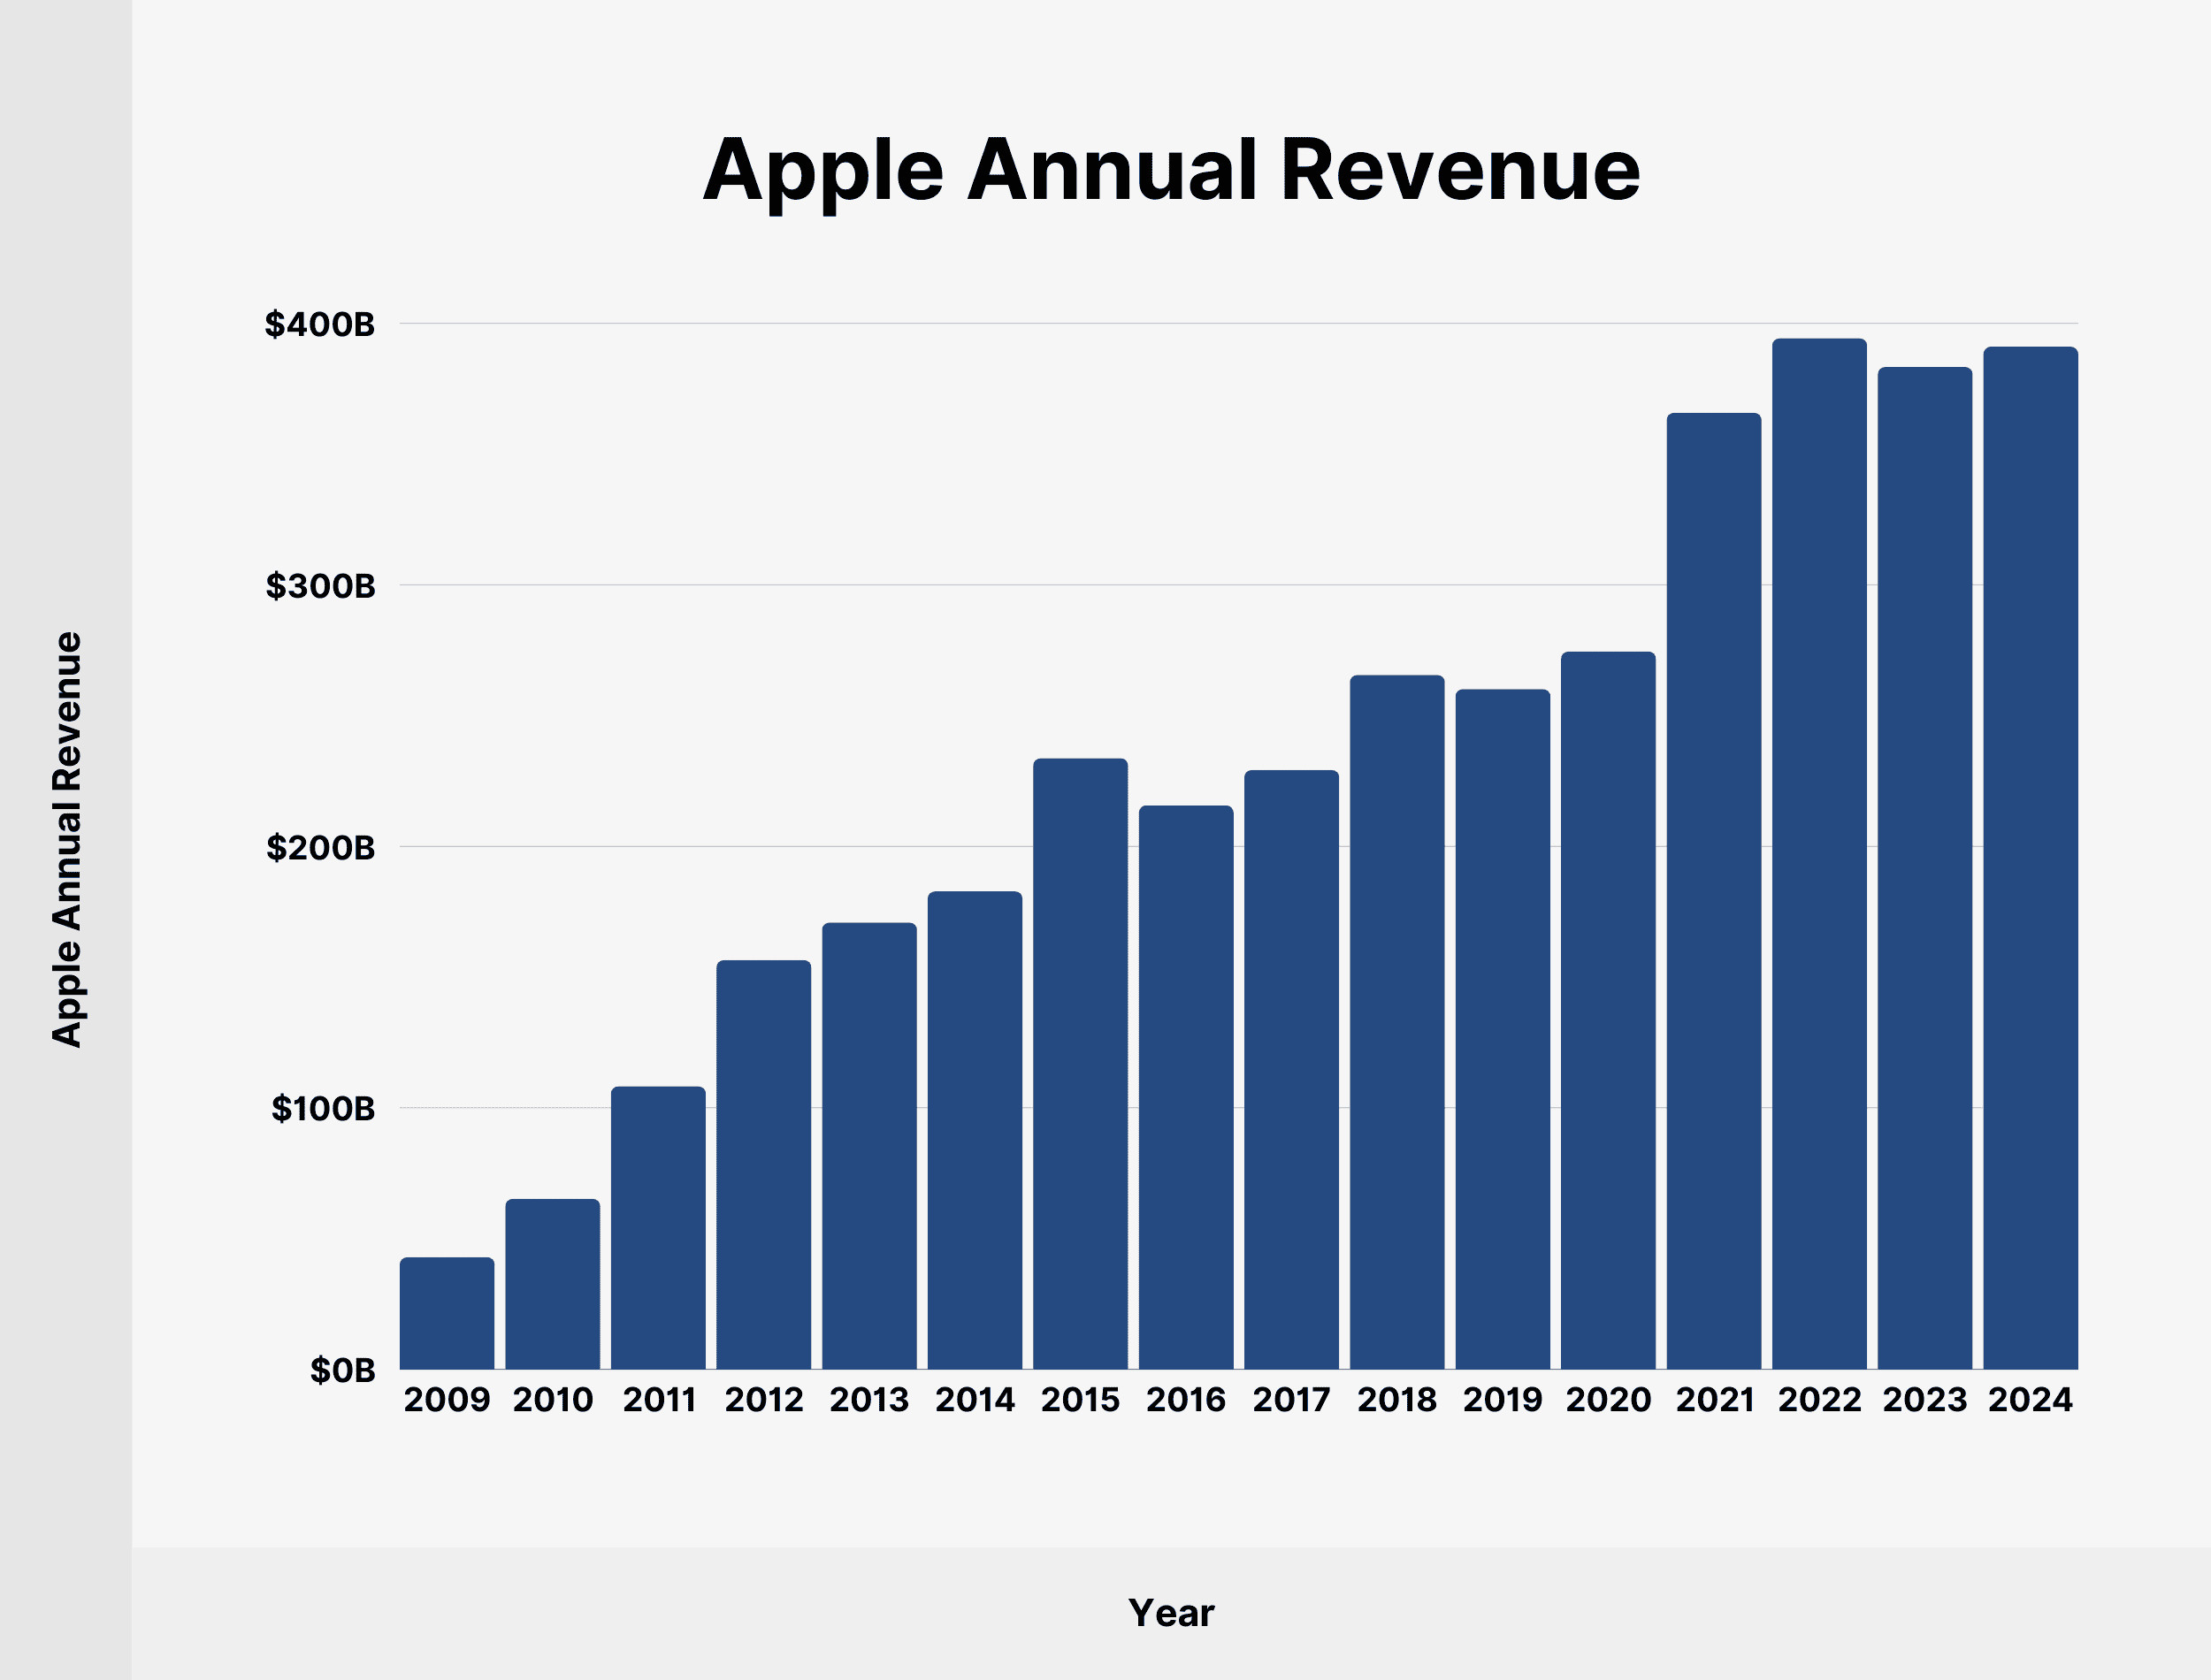
Apple’s annual revenue for 2024 was $391.04 billion, slightly down 2.02% compared to the previous fiscal year. While experiencing a slight decrease year-over-year, this revenue still showcases Apple’s strong market position and its ability to generate substantial income. This figure includes sales from iPhones, iPads, Macs, wearables, and services like the App Store and Apple Music.
 Apple Annual Revenue
Here’s a table showing Apple’s annual revenue since 2009:
| Year | Apple Annual Revenue |
|---|---|
| 2009 | $42.91 billion |
| 2010 | $65.23 billion |
| 2011 | $108.25 billion |
| 2012 | $156.51 billion |
| 2013 | $170.91 billion |
| 2014 | $182.8 billion |
| 2015 | $233.72 billion |
| 2016 | $215.64 billion |
| 2017 | $229.23 billion |
| 2018 | $265.6 billion |
| 2019 | $260.17 billion |
| 2020 | $274.52 billion |
| 2021 | $365.82 billion |
| 2022 | $394.33 billion |
| 2023 | $383.29 billion |
| 2024 | $391.04 billion |
Apple’s capacity to consistently generate hundreds of billions of dollars annually underscores its dominance in the tech industry. This revenue is a result of its diverse product range, loyal customer base, and global market reach. The annual revenue of Apple is a crucial indicator for investors, analysts, and tech enthusiasts who monitor the financial health and strategic direction of the company. The consistent high revenue figures underscore Apple’s ability to maintain its position as a leader in the consumer electronics and digital services sectors.
Source: Apple
2. What is Apple’s Quarterly Revenue?
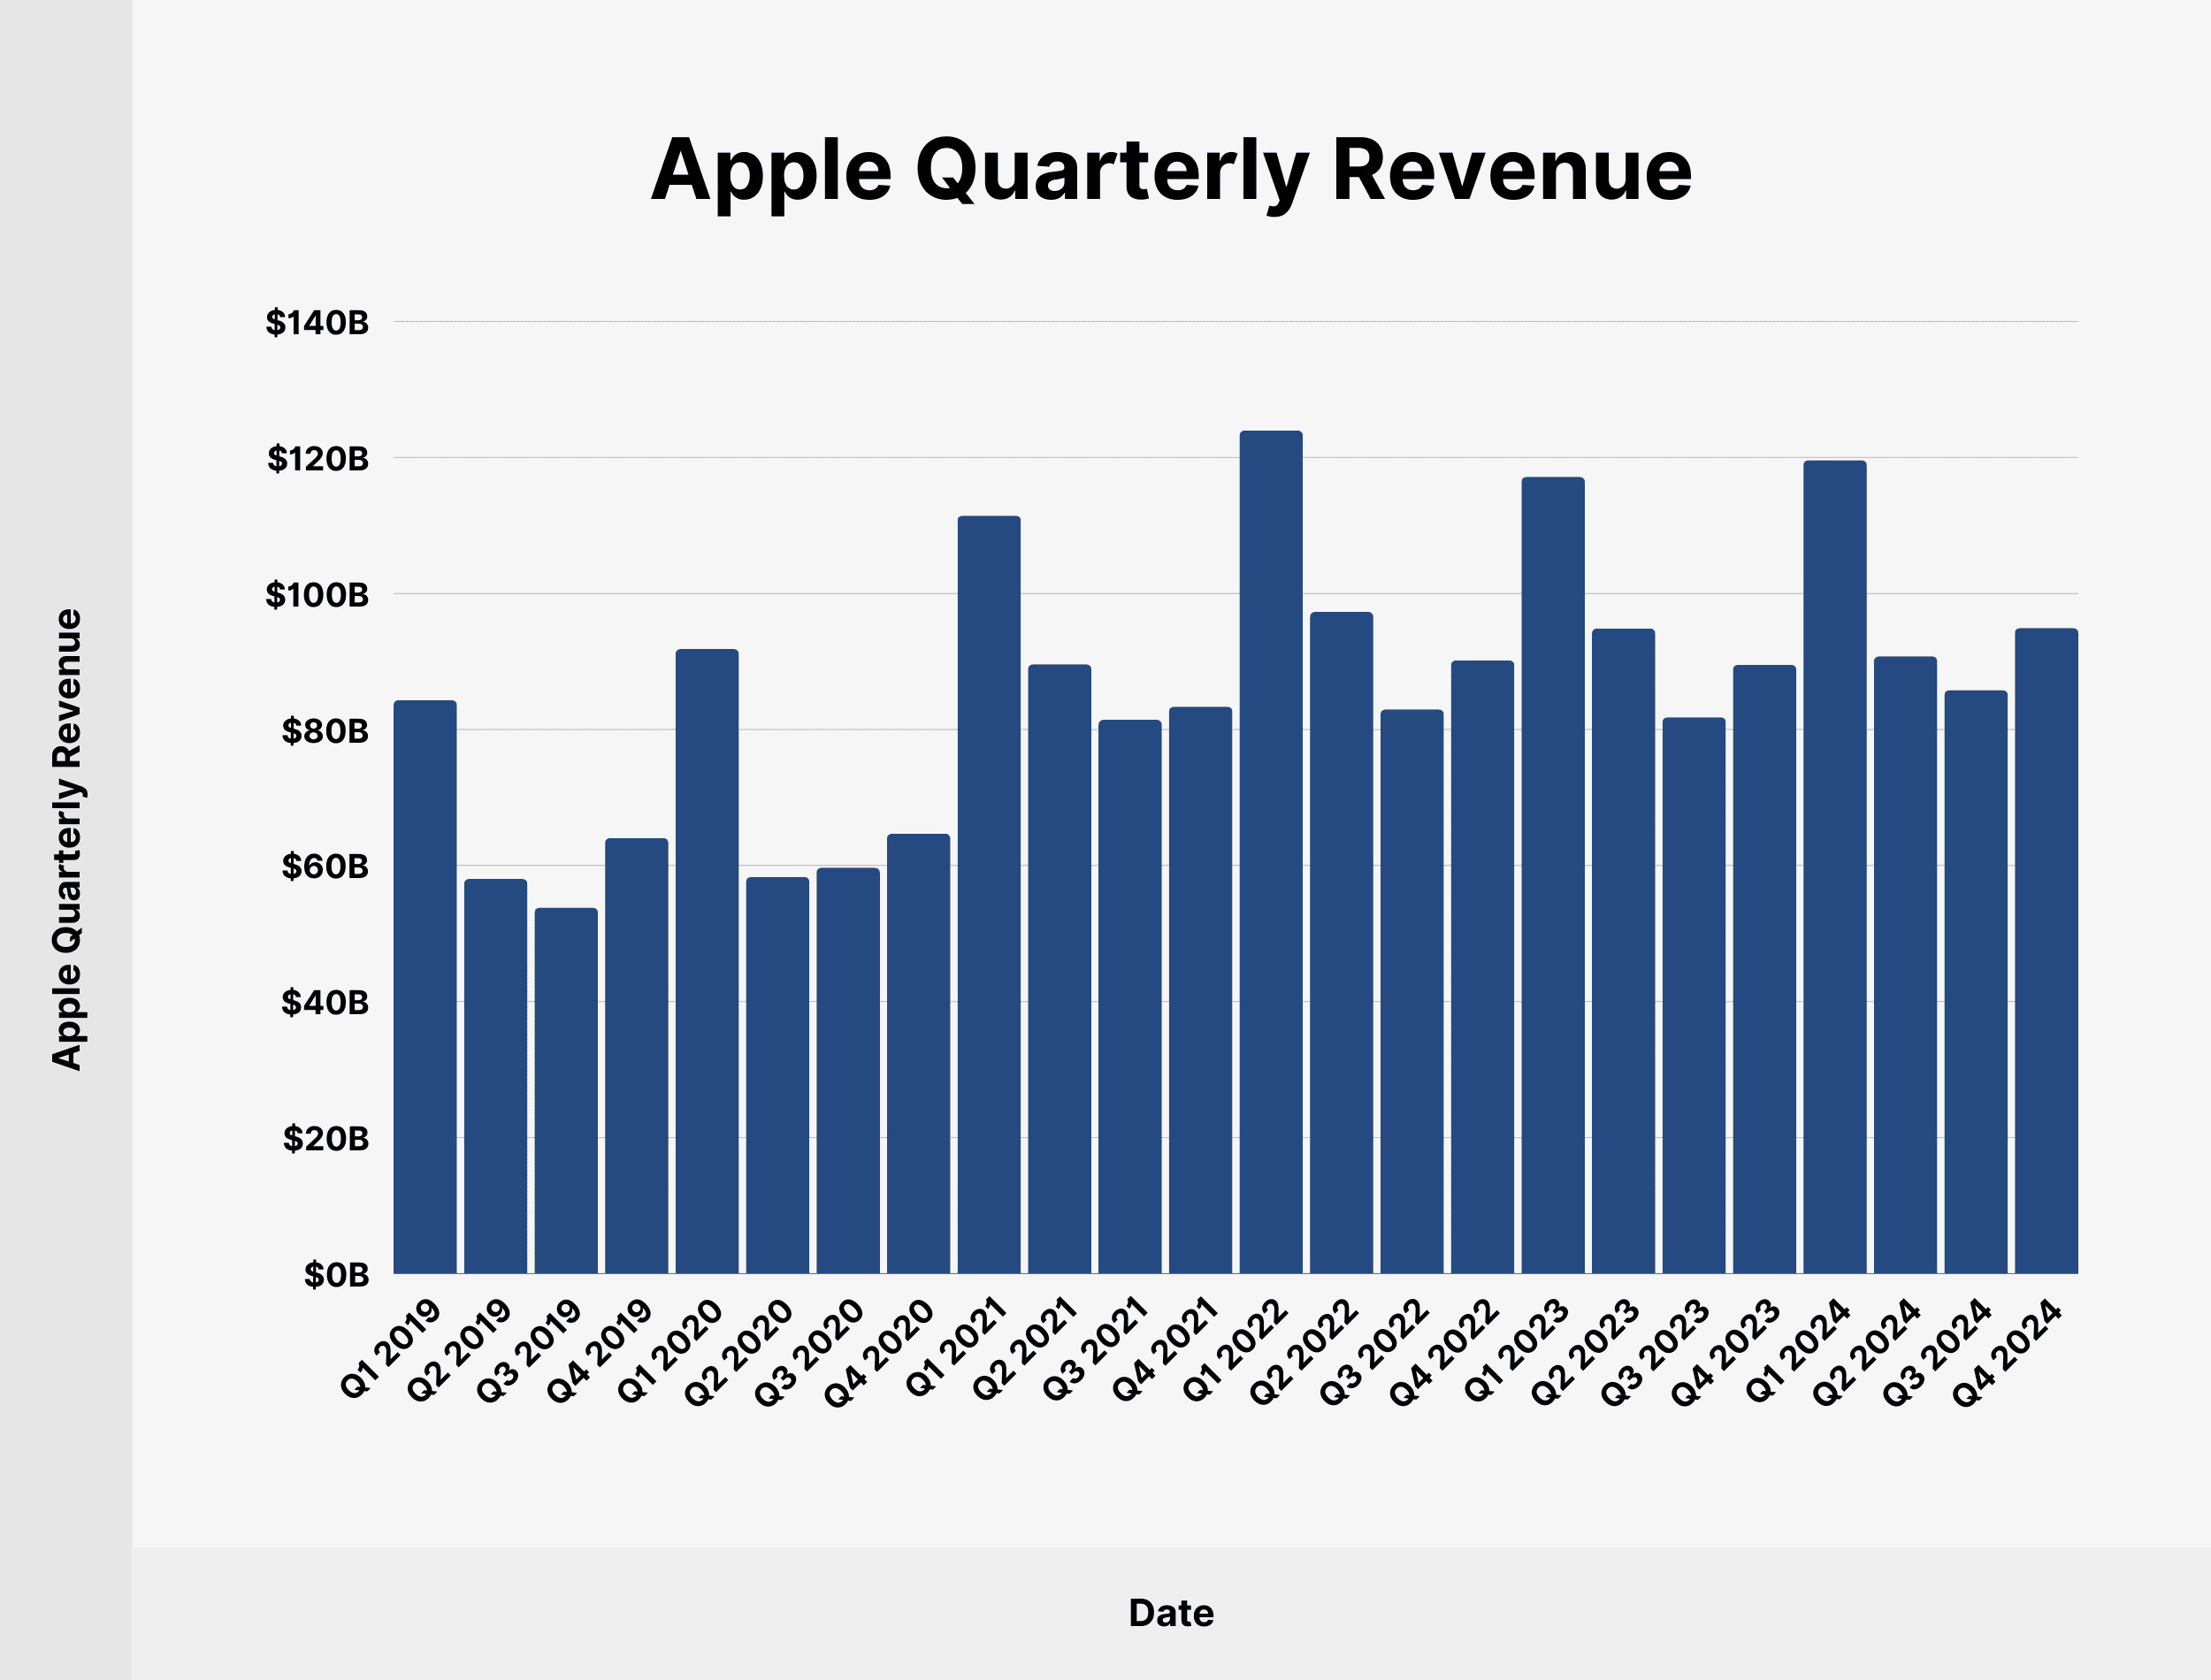
In the fourth quarter of 2024, Apple’s quarterly revenue reached $94.93 billion, marking a 6.07% increase year-over-year. This growth in quarterly revenue indicates a strong performance during the period, driven by product sales and service offerings. Apple’s financial results continue to impress, with substantial revenue generated each quarter.
 Apple Quarterly Revenue
Here’s a detailed breakdown of Apple’s quarterly revenue since Q1 2019:
| Date | Apple Quarterly Revenue |
|---|---|
| Q1 2019 | $84.31 billion |
| Q2 2019 | $58.02 billion |
| Q3 2019 | $53.81 billion |
| Q4 2019 | $64.04 billion |
| Q1 2020 | $91.82 billion |
| Q2 2020 | $58.31 billion |
| Q3 2020 | $59.69 billion |
| Q4 2020 | $64.7 billion |
| Q1 2021 | $111.44 billion |
| Q2 2021 | $89.58 billion |
| Q3 2021 | $81.43 billion |
| Q4 2021 | $83.36 billion |
| Q1 2022 | $123.95 billion |
| Q2 2022 | $97.28 billion |
| Q3 2022 | $82.96 billion |
| Q4 2022 | $90.15 billion |
| Q1 2023 | $117.15 billion |
| Q2 2023 | $94.84 billion |
| Q3 2023 | $81.8 billion |
| Q4 2023 | $89.5 billion |
| Q1 2024 | $119.58 billion |
| Q2 2024 | $90.75 billion |
| Q3 2024 | $85.78 billion |
| Q4 2024 | $94.93 billion |
The quarterly revenue performance demonstrates Apple’s financial health and its ability to adapt to market demands and economic conditions. The consistent growth in quarterly revenue underscores Apple’s strong brand and customer loyalty, which are critical factors in its sustained success. Analyzing Apple’s quarterly revenue trends provides insights into its operational efficiency, product demand, and overall financial strategy.
Source: Apple
3. How Much Revenue Does Apple Make from iPhone Sales?
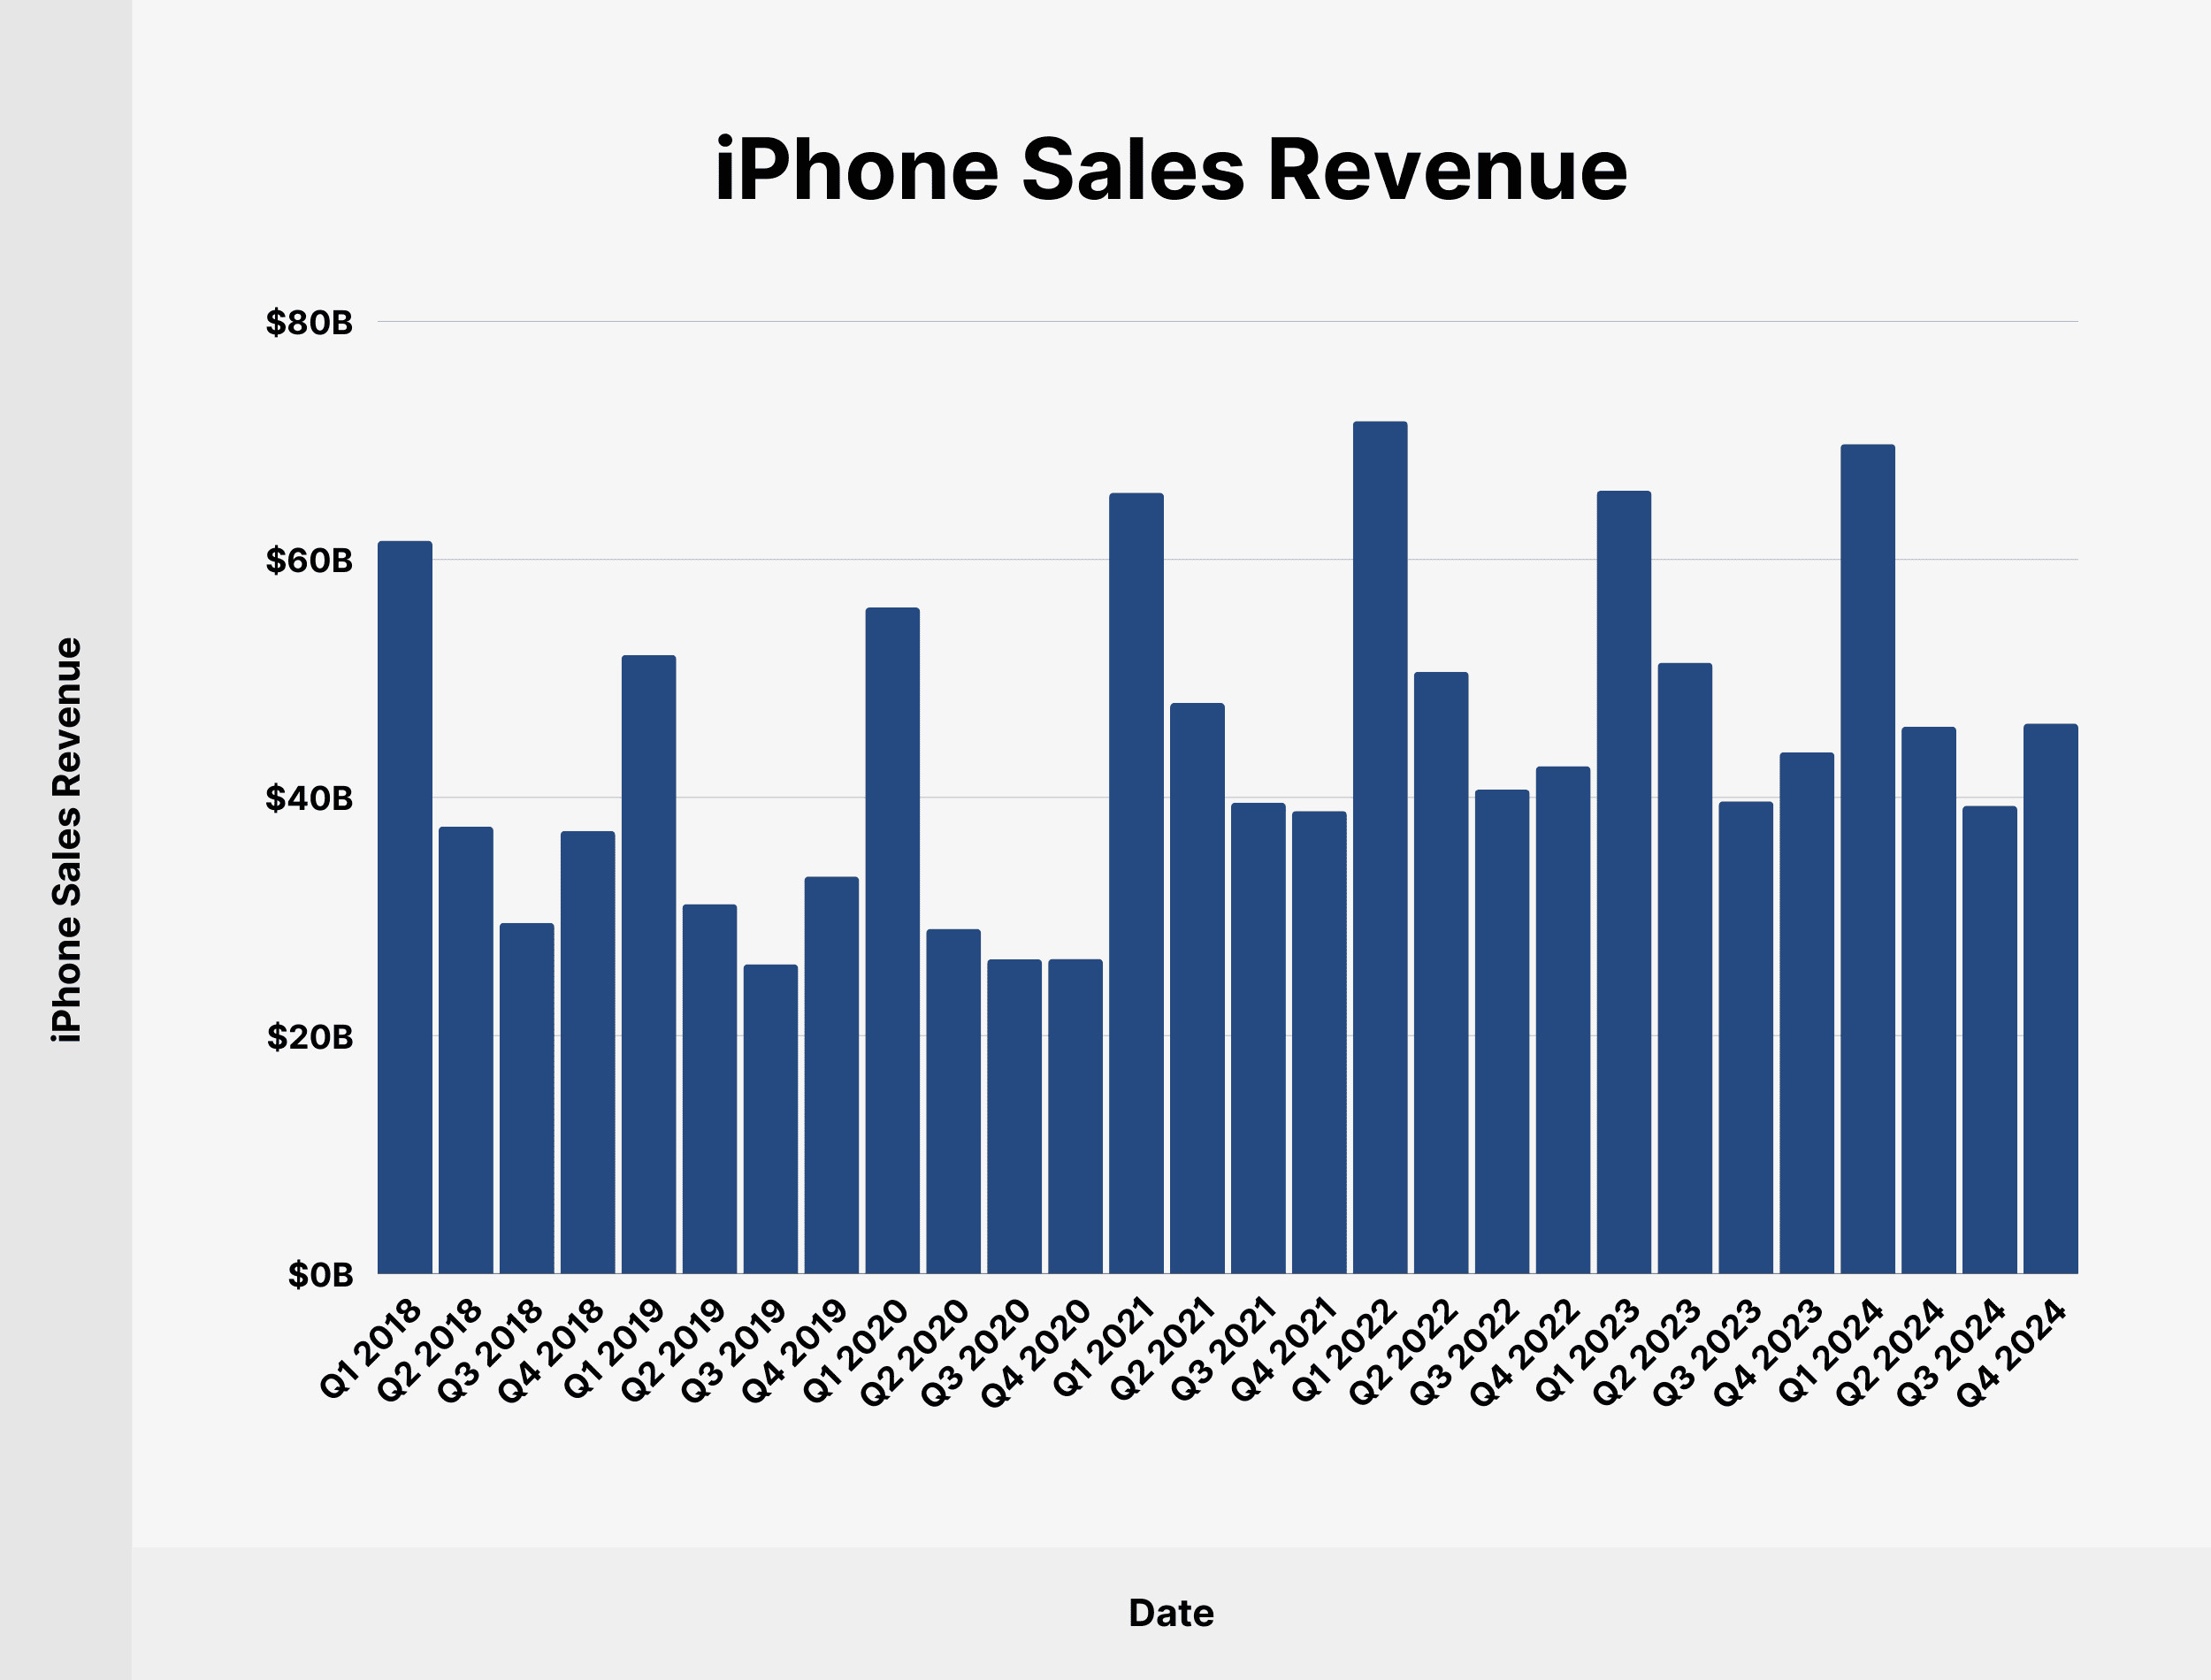
In Q4 2024, iPhone sales contributed $46.22 billion to Apple’s quarterly revenue, representing 48.69% of the total. This figure confirms that the iPhone remains Apple’s largest revenue category. The revenue from iPhone sales is critical to Apple’s financial performance.
 iPhone Sales Revenue
Here is a detailed breakdown of iPhone sales since Q1 2018, including their share of Apple’s total revenue:
| Date | iPhone Sales | Share of Total Apple Revenue |
|---|---|---|
| Q1 2018 | $61.58 billion | 69.74% |
| Q2 2018 | $37.56 billion | 62.21% |
| Q3 2018 | $29.47 billion | 56.15% |
| Q4 2018 | $37.19 billion | 59.12% |
| Q1 2019 | $51.98 billion | 61.66% |
| Q2 2019 | $31.05 billion | 53.52% |
| Q3 2019 | $25.99 billion | 48.29% |
| Q4 2019 | $33.36 billion | 52.1% |
| Q1 2020 | $55.96 billion | 60.9% |
| Q2 2020 | $28.96 billion | 49.7% |
| Q3 2020 | $26.42 billion | 44.26% |
| Q4 2020 | $26.44 billion | 40.9% |
| Q1 2021 | $65.6 billion | 58.86% |
| Q2 2021 | $47.94 billion | 53.51% |
| Q3 2021 | $39.57 billion | 48.59% |
| Q4 2021 | $38.87 billion | 46.63% |
| Q1 2022 | $71.63 billion | 57.8% |
| Q2 2022 | $50.57 billion | 51.99% |
| Q3 2022 | $40.67 billion | 49.02% |
| Q4 2022 | $42.63 billion | 47.29% |
| Q1 2023 | $65.78 billion | 56.14% |
| Q2 2023 | $51.33 billion | 54.13% |
| Q3 2023 | $39.67 billion | 48.5% |
| Q4 2023 | $43.81 billion | 48.95% |
| Q1 2024 | $69.7 billion | 58.29% |
| Q2 2024 | $45.96 billion | 50.64% |
| Q3 2024 | $39.3 billion | 45.82% |
| Q4 2024 | $46.22 billion | 48.69% |
The iPhone’s continued dominance in Apple’s revenue portfolio highlights its significance as a flagship product. This revenue stream is bolstered by constant innovation, strong branding, and a loyal customer base. The reliance on iPhone sales also means that Apple’s financial health is closely tied to the success and market reception of its latest iPhone models.
4. What is Apple’s Revenue from Services?
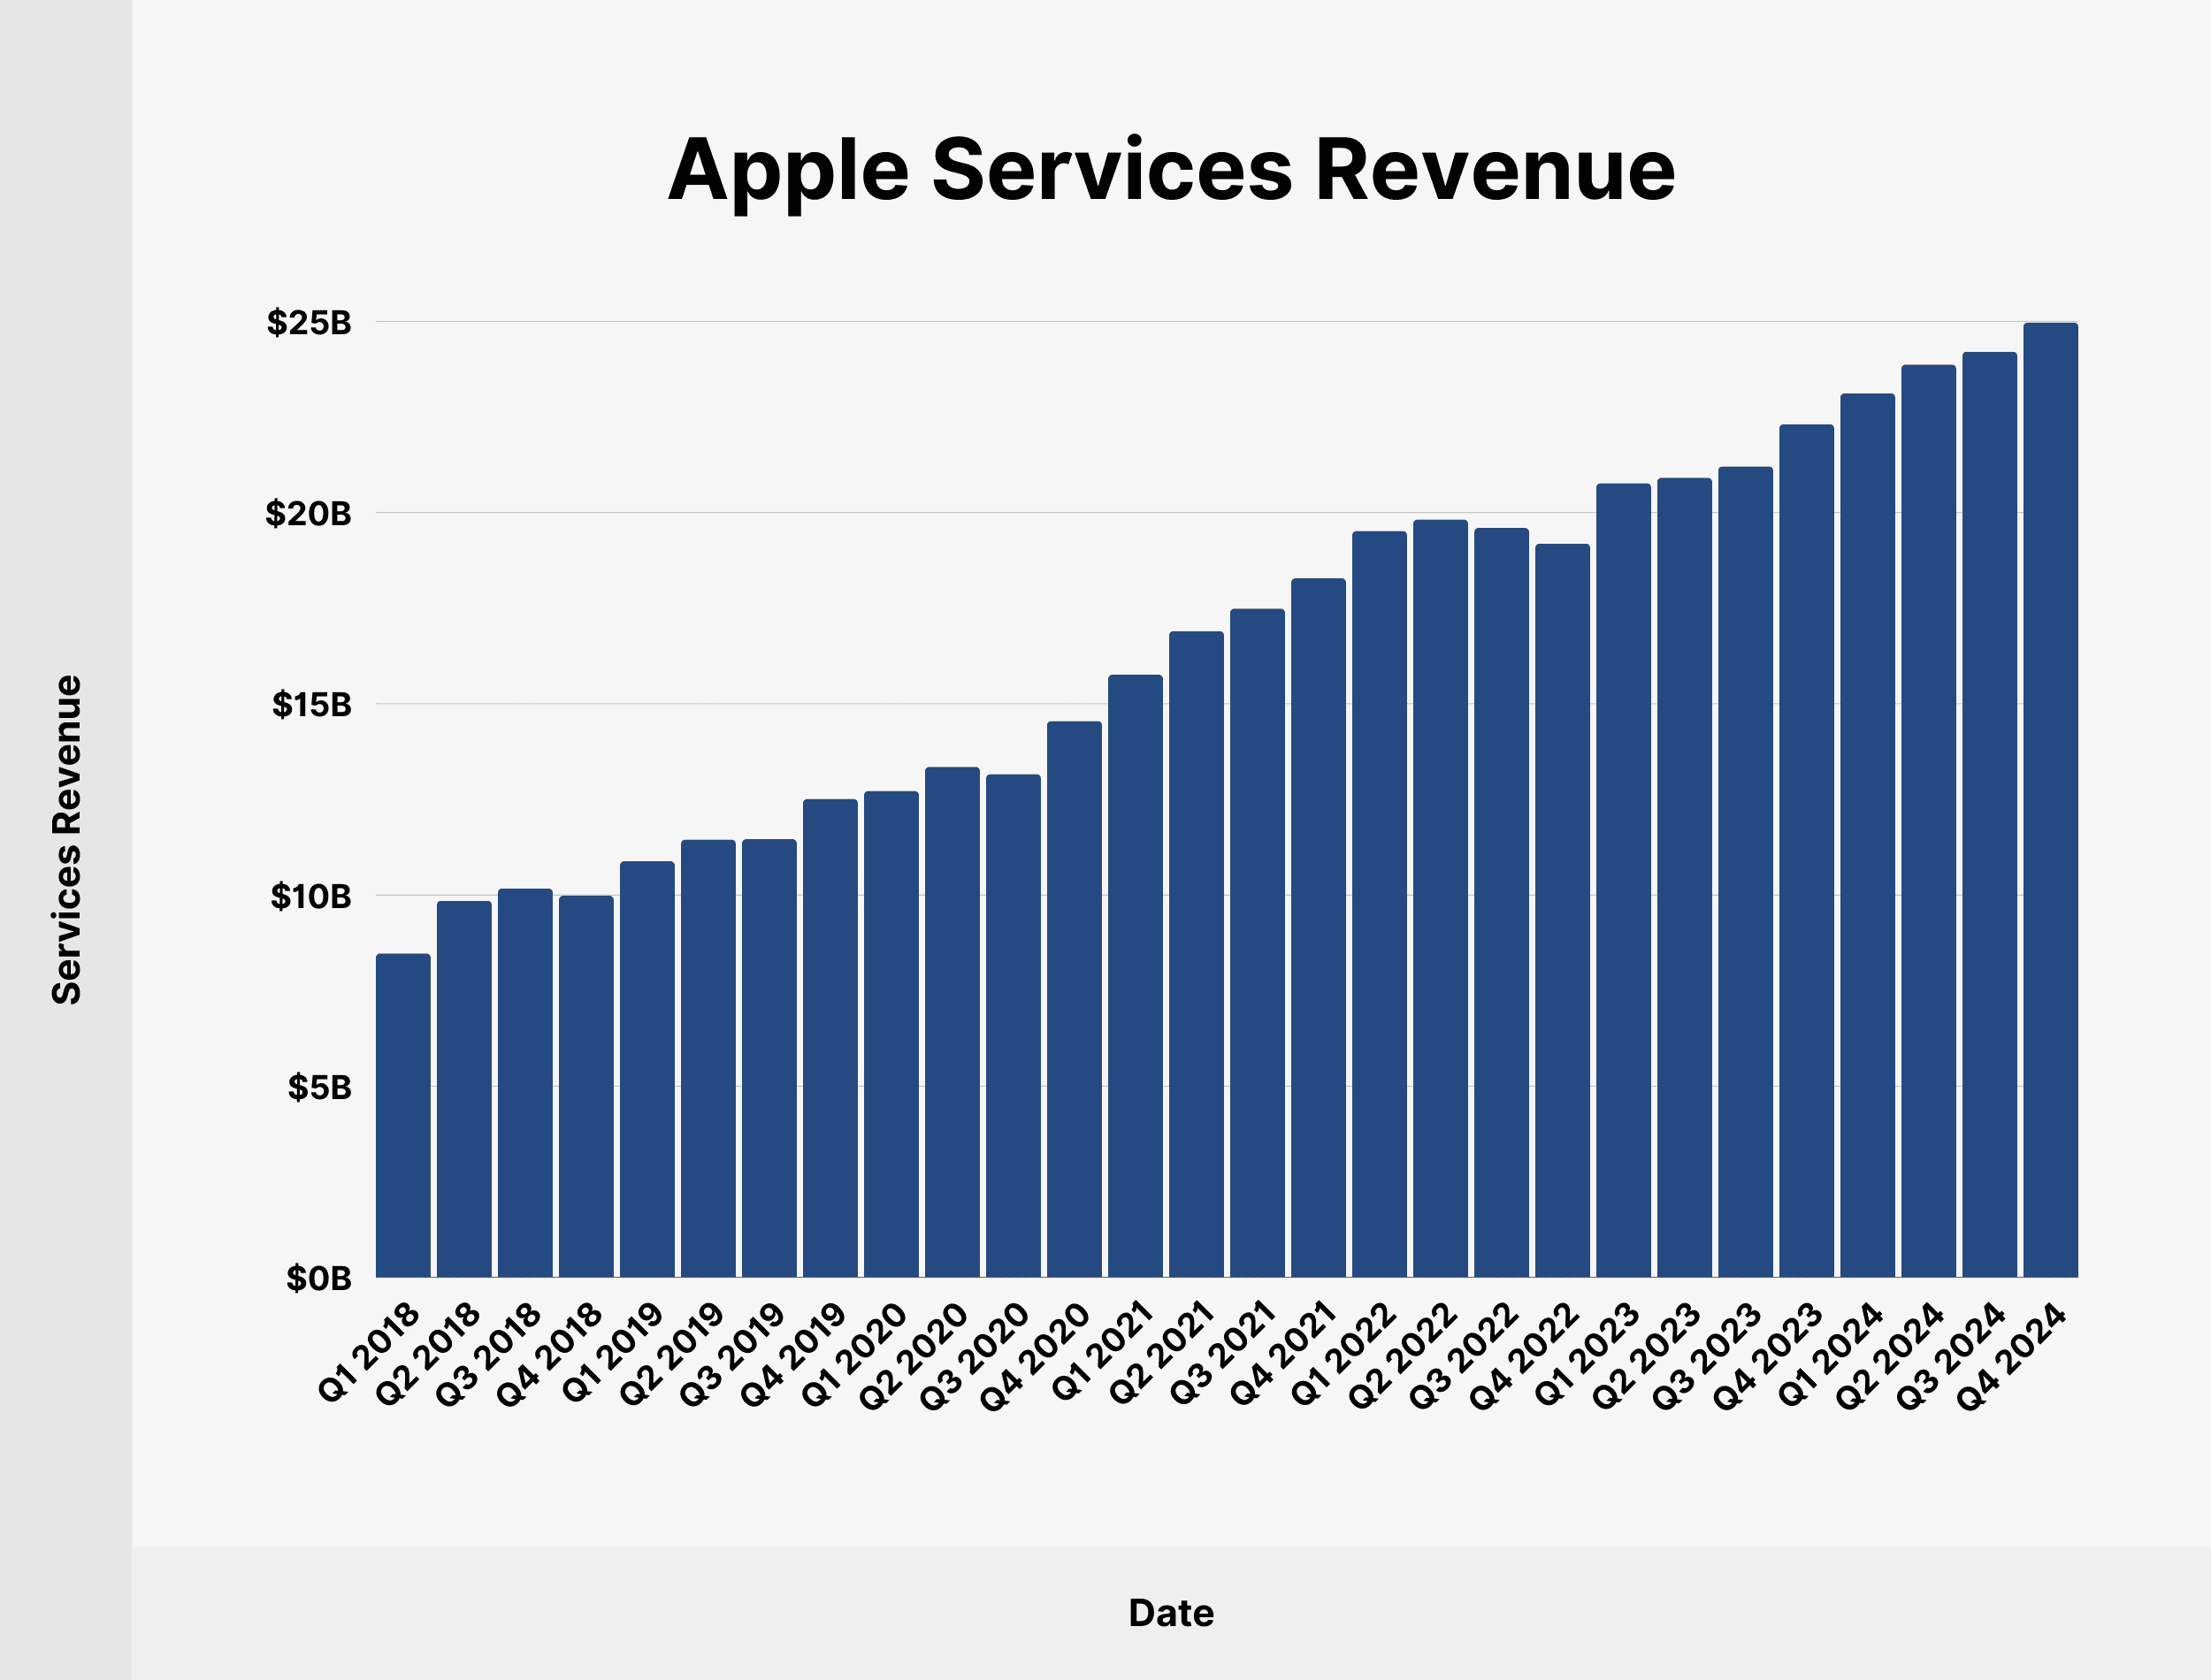
Apple’s service business, which includes revenue from the App Store, iTunes Store, AppleCare, Apple Pay, and other services, generated $24.97 billion in Q4 2024. This accounts for 26.31% of Apple’s total quarterly revenue. The increasing contribution from services indicates a successful diversification of Apple’s revenue streams.
 Apple Services Revenue
Here’s a look at Apple’s services revenue since Q1 2018:
| Date | Services Revenue | Share of Total Apple Revenue |
|---|---|---|
| Q1 2018 | $8.47 billion | 9.59% |
| Q2 2018 | $9.85 billion | 15.03% |
| Q3 2018 | $10.17 billion | 17.93% |
| Q4 2018 | $9.98 billion | 15.87% |
| Q1 2019 | $10.88 billion | 12.9% |
| Q2 2019 | $11.45 billion | 19.74% |
| Q3 2019 | $11.46 billion | 21.29% |
| Q4 2019 | $12.51 billion | 19.54% |
| Q1 2020 | $12.72 billion | 13.85% |
| Q2 2020 | $13.35 billion | 22.89% |
| Q3 2020 | $13.16 billion | 22.04% |
| Q4 2020 | $14.55 billion | 22.5% |
| Q1 2021 | $15.76 billion | 14.14% |
| Q2 2021 | $16.9 billion | 18.87% |
| Q3 2021 | $17.49 billion | 21.47% |
| Q4 2021 | $18.28 billion | 21.93% |
| Q1 2022 | $19.52 billion | 15.76% |
| Q2 2022 | $19.82 billion | 20.37% |
| Q3 2022 | $19.6 billion | 23.63% |
| Q4 2022 | $19.19 billion | 21.28% |
| Q1 2023 | $20.77 billion | 17.73% |
| Q2 2023 | $20.91 billion | 22.05% |
| Q3 2023 | $21.21 billion | 25.93% |
| Q4 2023 | $22.31 billion | 24.93% |
| Q1 2024 | $23.12 billion | 19.33% |
| Q2 2024 | $23.87 billion | 26.3% |
| Q3 2024 | $24.21 billion | 28.23% |
| Q4 2024 | $24.97 billion | 26.31% |
The strength of Apple’s services business is crucial for sustaining long-term growth. These services not only generate substantial revenue but also enhance customer loyalty by providing a comprehensive ecosystem. As the services segment continues to expand, it reduces Apple’s reliance on hardware sales and creates more stable and recurring revenue streams.
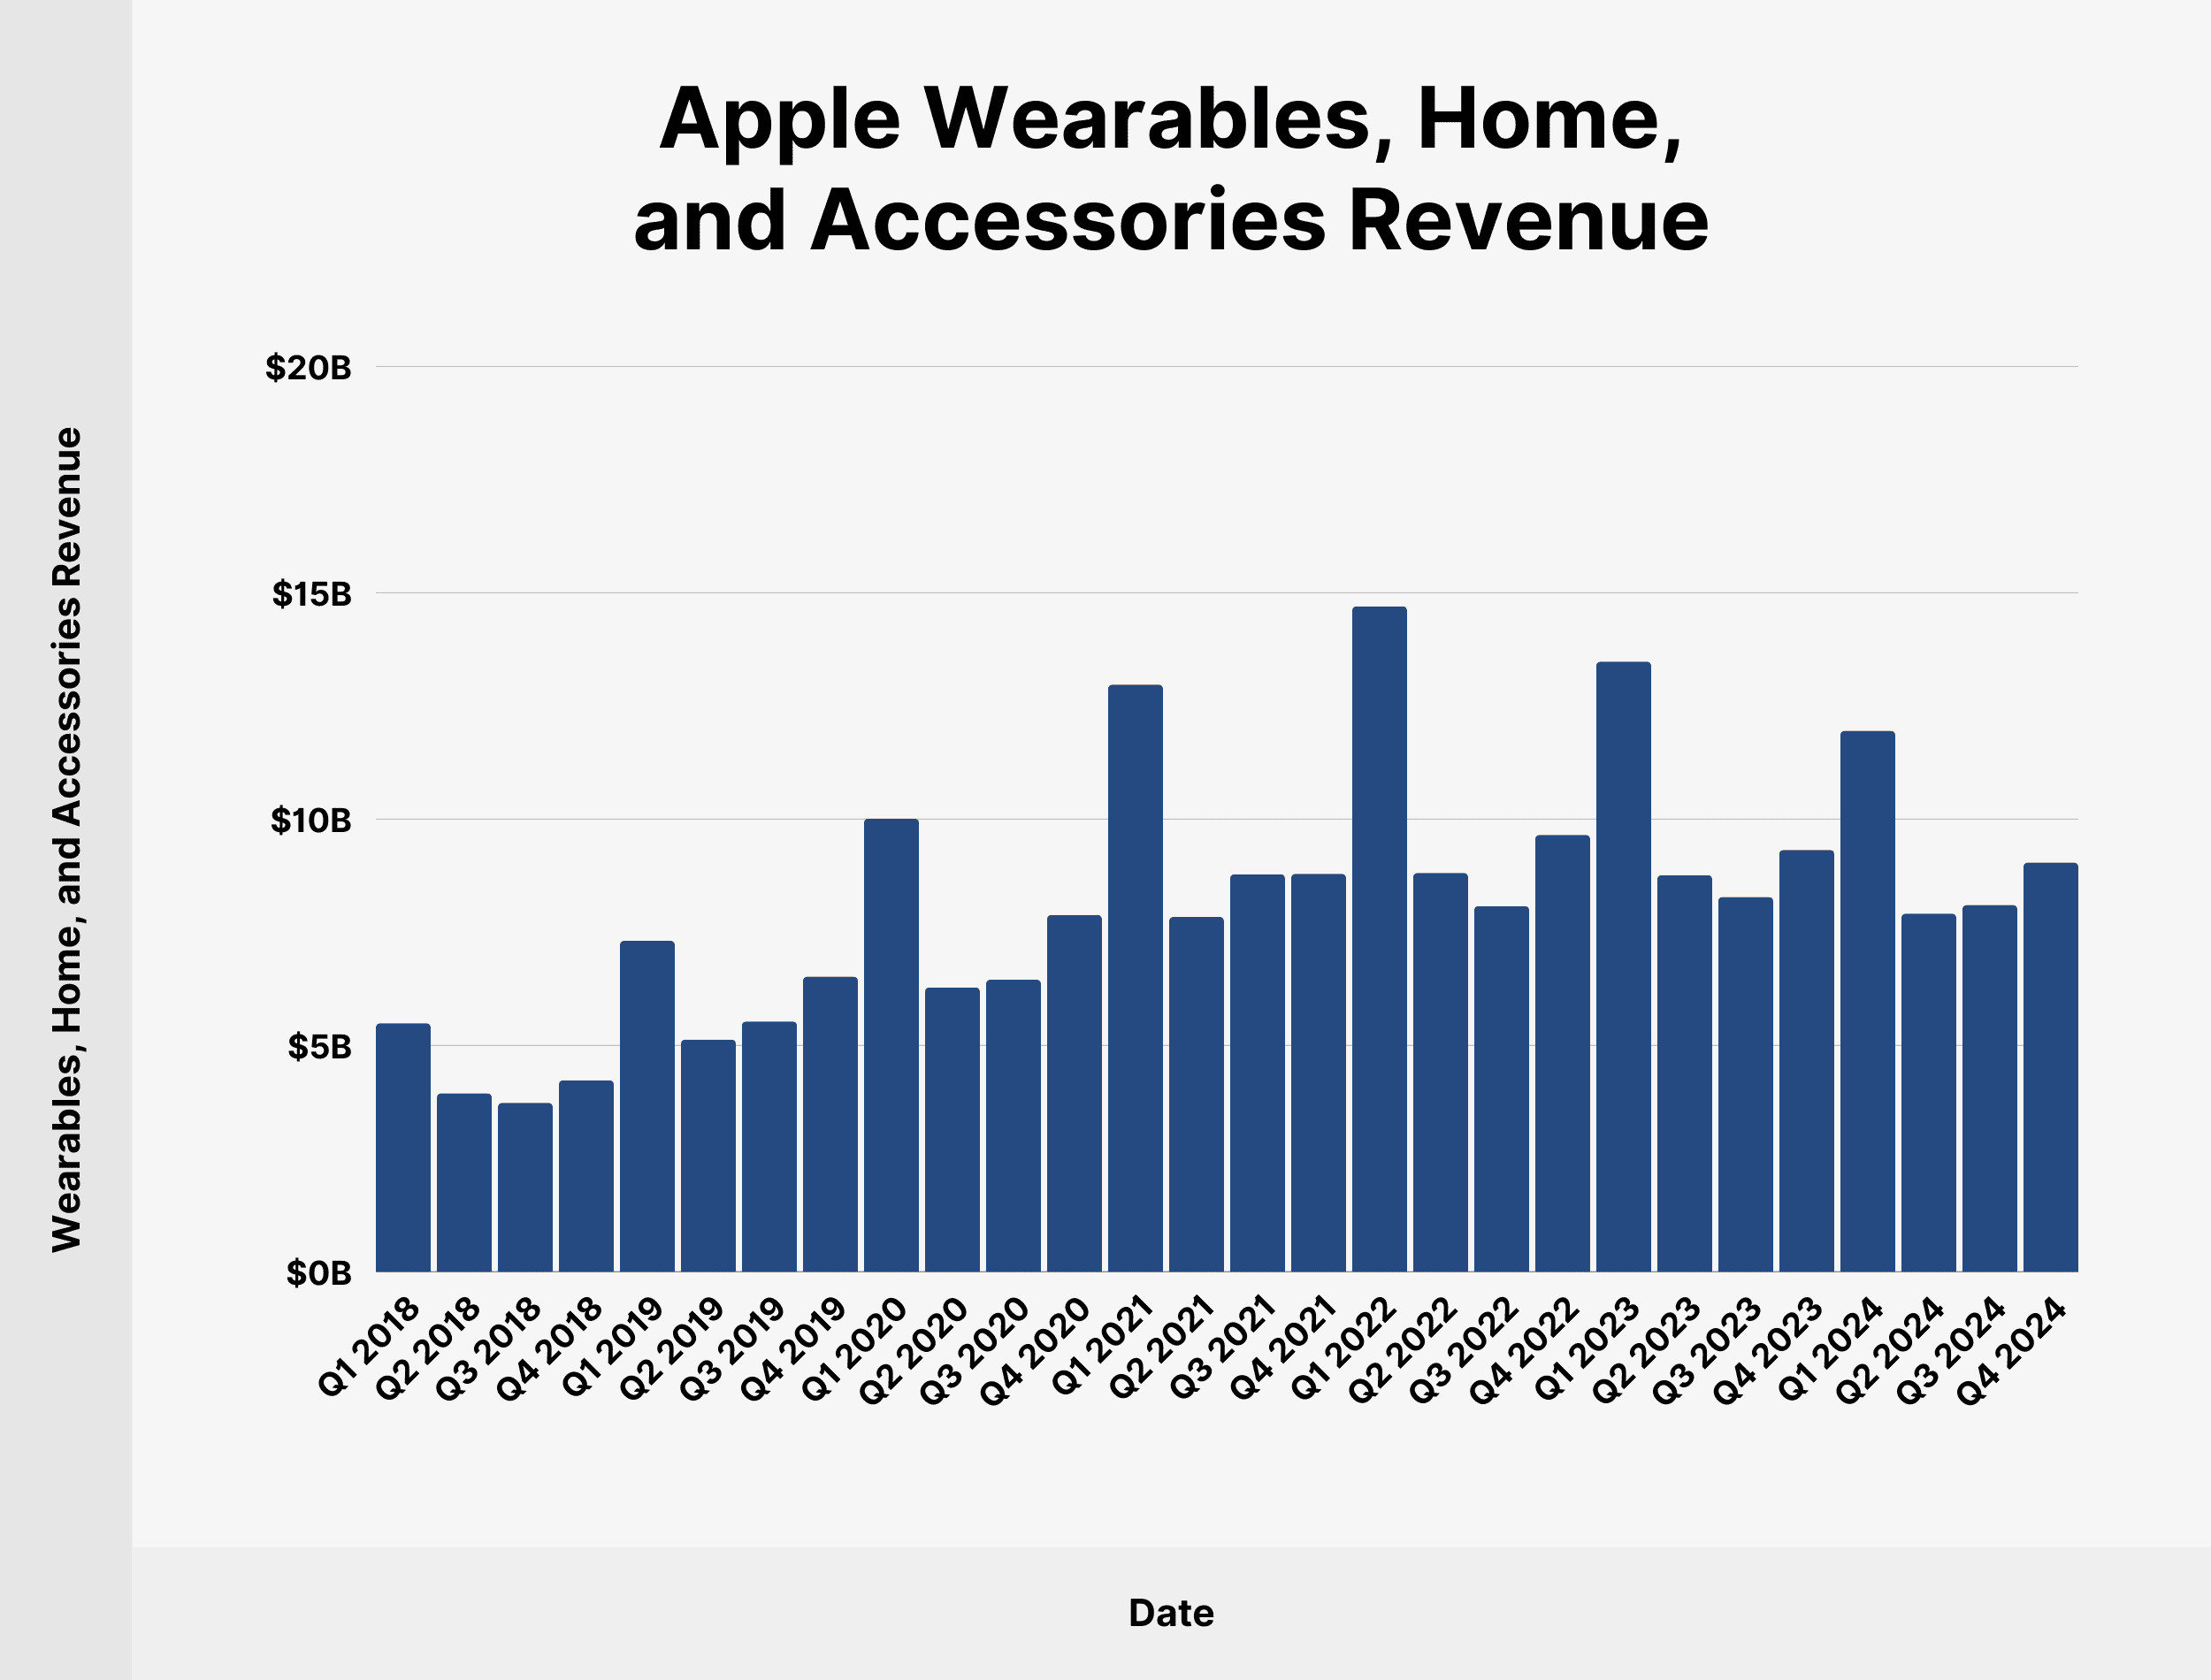
5. What is Apple’s Revenue from Wearables, Home, and Accessories?
Apple’s wearables, home, and accessories category, including the Apple Watch, wireless headphones, HomePod, Apple TV, and related accessories, generated $9.04 billion in Q4 2024. This figure accounts for 9.52% of Apple’s total revenue. This segment has shown consistent growth and has become a significant contributor to Apple’s financial success.
 Apple Wearables, Home, and Accessories Revenue
Here is a detailed breakdown of Apple’s wearables, home, and accessories revenue since Q1 2018:
| Date | Wearables, Home, and Accessories Revenue | Share of Total Apple Revenue |
|---|---|---|
| Q1 2018 | $5.49 billion | 6.22% |
| Q2 2018 | $3.94 billion | 6.47% |
| Q3 2018 | $3.73 billion | 7.02% |
| Q4 2018 | $4.23 billion | 6.7% |
| Q1 2019 | $7.31 billion | 8.67% |
| Q2 2019 | $5.13 billion | 8.84% |
| Q3 2019 | $5.53 billion | 10.27% |
| Q4 2019 | $6.52 billion | 10.18% |
| Q1 2020 | $10.01 billion | 10.9% |
| Q2 2020 | $6.28 billion | 10.78% |
| Q3 2020 | $6.45 billion | 10.81% |
| Q4 2020 | $7.88 billion | 12.2% |
| Q1 2021 | $12.97 billion | 11.64% |
| Q2 2021 | $7.84 billion | 8.75% |
| Q3 2021 | $8.78 billion | 10.78% |
| Q4 2021 | $8.79 billion | 10.54% |
| Q1 2022 | $14.7 billion | 11.86% |
| Q2 2022 | $8.81 billion | 9.05% |
| Q3 2022 | $8.08 billion | 9.74% |
| Q4 2022 | $9.65 billion | 10.7% |
| Q1 2023 | $13.48 billion | 11.51% |
| Q2 2023 | $8.76 billion | 9.23% |
| Q3 2023 | $8.28 billion | 10.13% |
| Q4 2023 | $9.32 billion | 10.42% |
| Q1 2024 | $11.95 billion | 10% |
| Q2 2024 | $7.91 billion | 8.72% |
| Q3 2024 | $8.1 billion | 9.44% |
| Q4 2024 | $9.04 billion | 9.52% |
The wearables, home, and accessories category is a key area for Apple’s future growth. As technology evolves and consumer demand for connected devices increases, this segment is expected to continue its upward trajectory. The diverse range of products in this category, from smartwatches to audio devices, positions Apple to capture a larger share of the market.
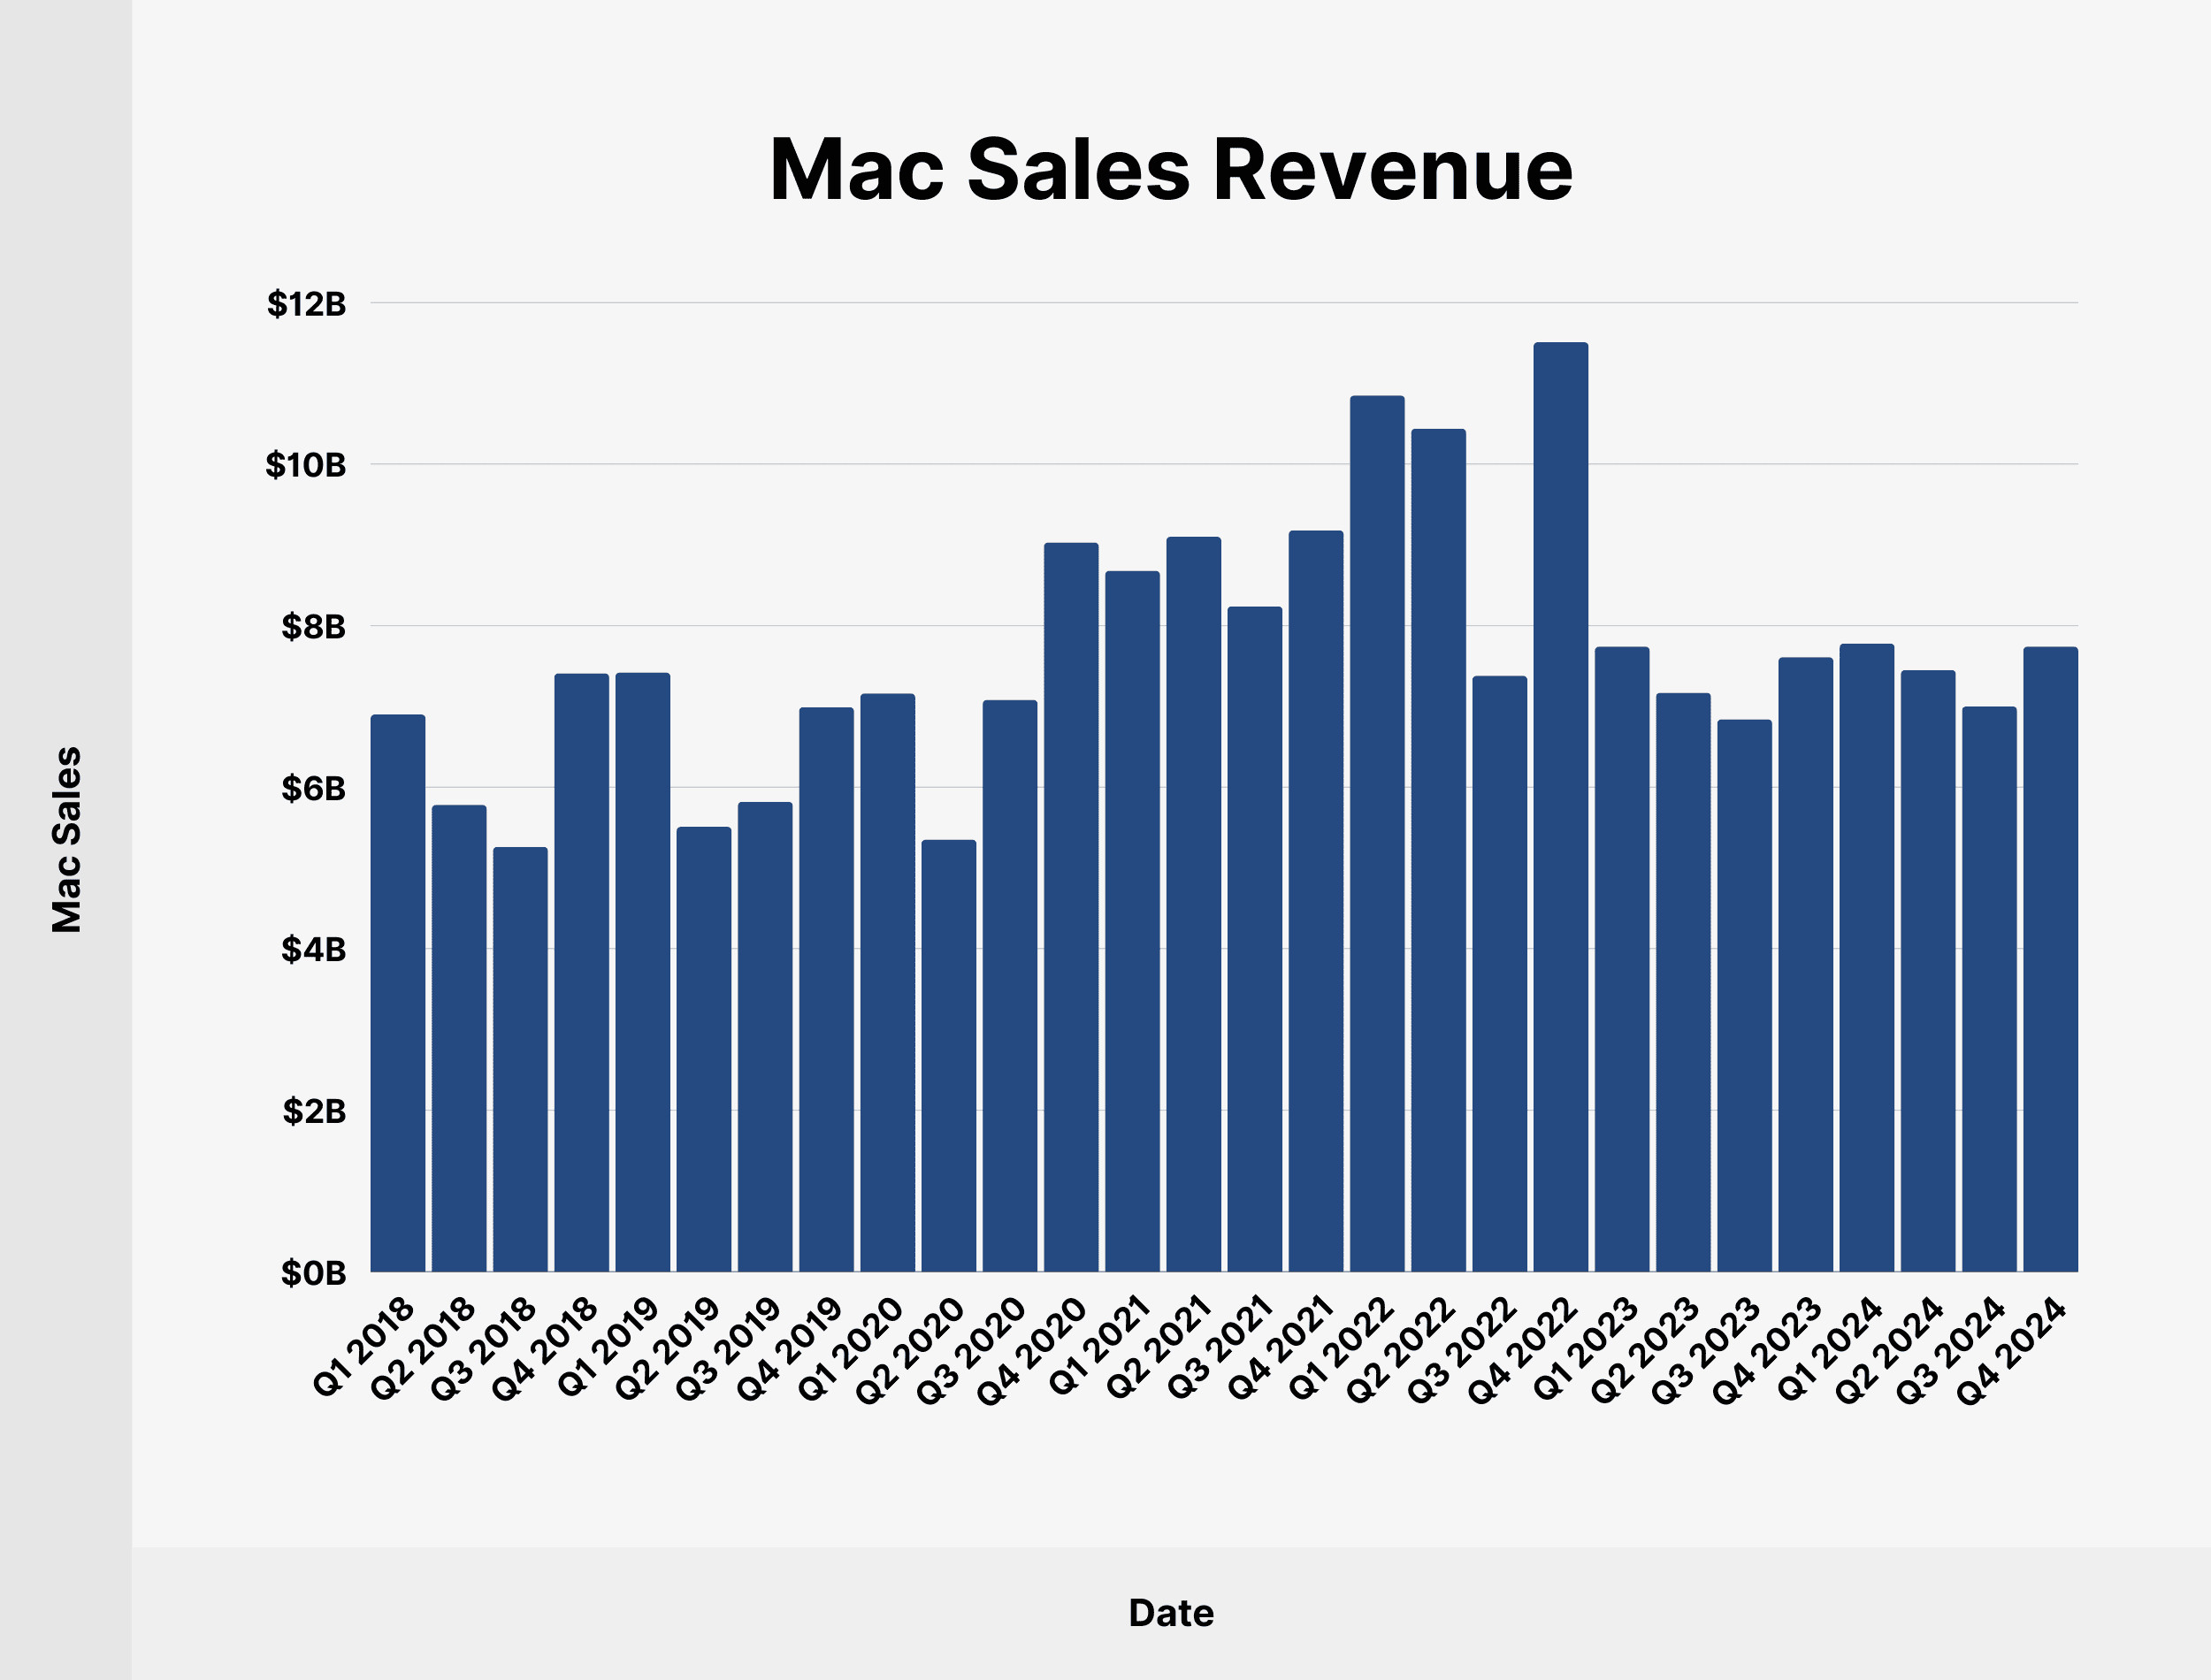
6. How Much Revenue Does Apple Make from Mac Sales?
In Q4 2024, Mac sales contributed $7.74 billion to Apple’s total quarterly revenue, accounting for 8.15%. The Mac continues to be a significant product in Apple’s lineup, driving substantial revenue. Its steady sales performance is a testament to its popularity among professionals and consumers alike.
 Mac Sales Revenue
Here is a table showing Mac revenue since Q1 2018:
| Date | Mac Sales | Share of Total Apple Revenue |
|---|---|---|
| Q1 2018 | $6.9 billion | 7.81% |
| Q2 2018 | $5.78 billion | 9.57% |
| Q3 2018 | $5.26 billion | 10% |
| Q4 2018 | $7.41 billion | 11.78% |
| Q1 2019 | $7.42 billion | 8.8% |
| Q2 2019 | $5.51 billion | 9.5% |
| Q3 2019 | $5.82 billion | 10.82% |
| Q4 2019 | $6.99 billion | 10.92% |
| Q1 2020 | $7.16 billion | 7.8% |
| Q2 2020 | $5.35 billion | 9.18% |
| Q3 2020 | $7.08 billion | 11.86% |
| Q4 2020 | $9.03 billion | 14% |
| Q1 2021 | $8.68 billion | 7.78% |
| Q2 2021 | $9.1 billion | 10.16% |
| Q3 2021 | $8.24 billion | 10.11% |
| Q4 2021 | $9.18 billion | 11.01% |
| Q1 2022 | $10.85 billion | 8.76% |
| Q2 2022 | $10.44 billion | 10.73% |
| Q3 2022 | $7.38 billion | 8.9% |
| Q4 2022 | $11.51 billion | 12.77% |
| Q1 2023 | $7.74 billion | 6.6% |
| Q2 2023 | $7.17 billion | 7.56% |
| Q3 2023 | $6.84 billion | 8.36% |
| Q4 2023 | $7.61 billion | 8.5% |
| Q1 2024 | $7.78 billion | 6.51% |
| Q2 2024 | $7.45 billion | 8.21% |
| Q3 2024 | $7 billion | 8.16% |
| Q4 2024 | $7.74 billion | 8.15% |
The Mac’s ability to maintain a significant share of Apple’s revenue demonstrates its enduring appeal and functionality. With advancements in hardware and software, the Mac continues to be a preferred choice for many users. These sales also reflect the Mac’s critical role in Apple’s overall ecosystem.
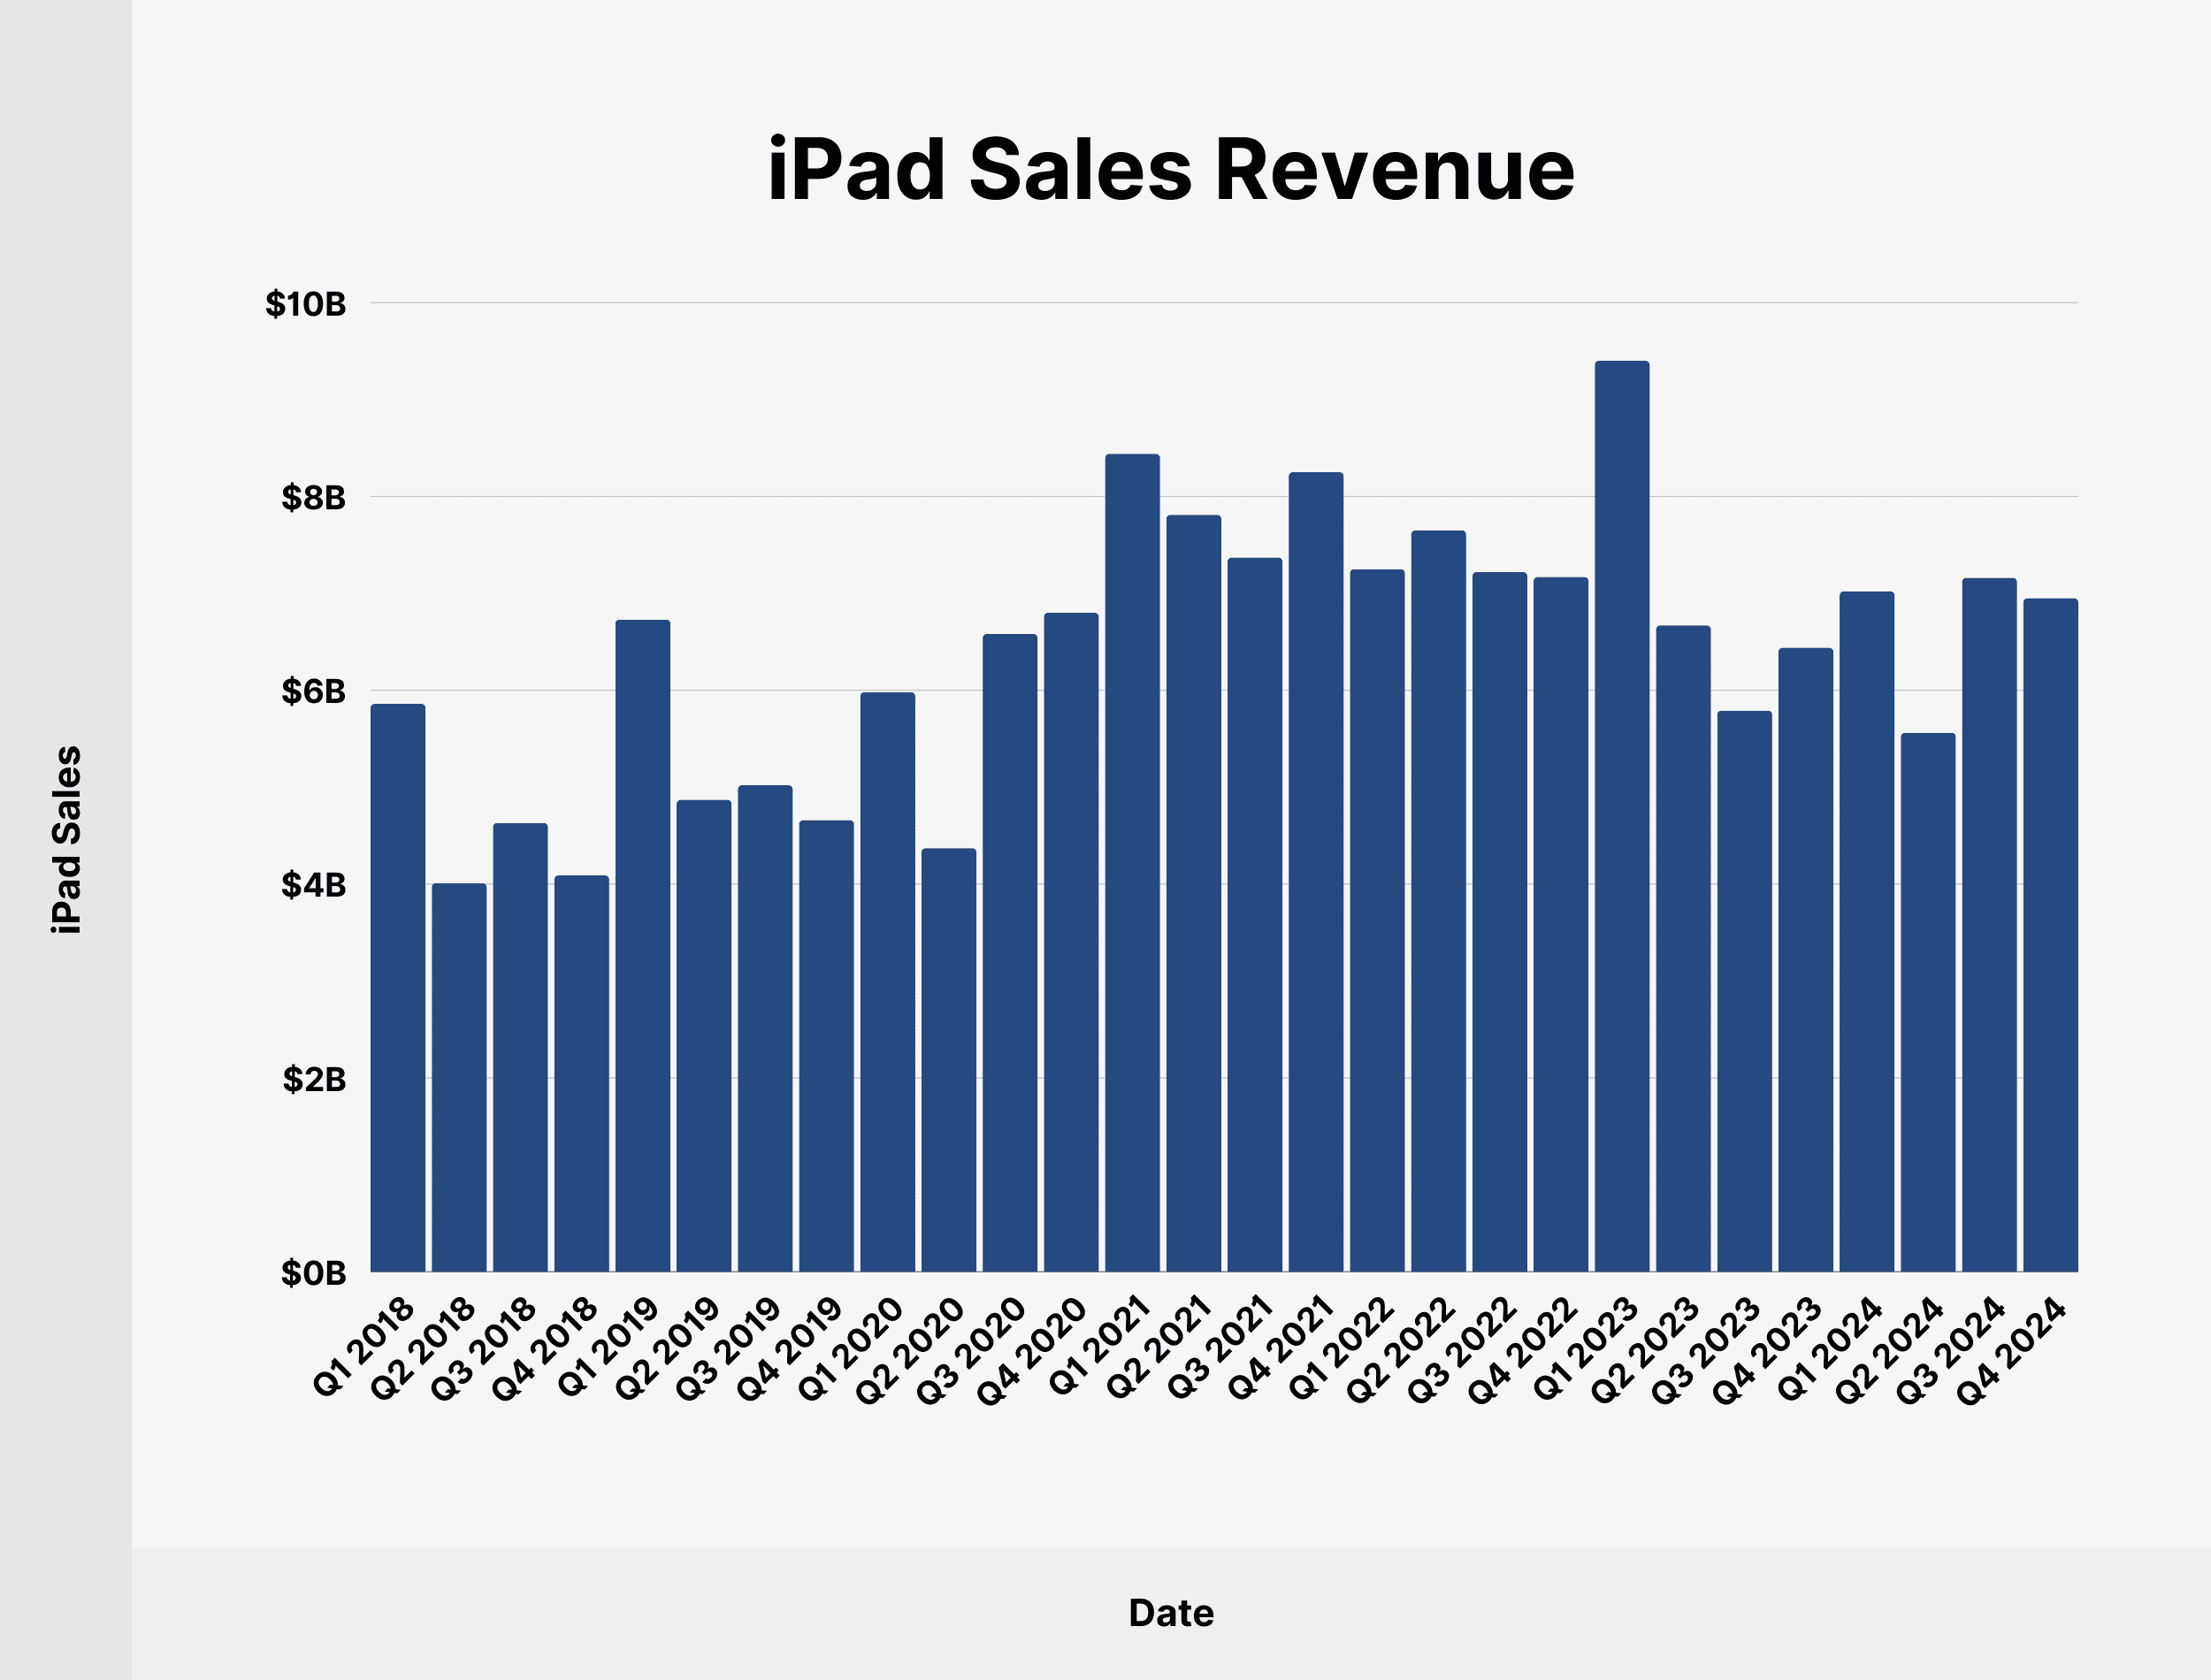
7. How Much Revenue Does Apple Make from iPad Sales?
Apple’s iPad sales reached $6.95 billion in Q4 2024, accounting for 7.32% of total quarterly revenue. This revenue indicates a solid performance for the iPad, reflecting its continued demand among consumers for various uses, including productivity and entertainment.
 iPad Sales Revenue
Here is a table showing iPad sales since Q1 2018:
| Date | iPad Sales | Share of Total Apple Revenue |
|---|---|---|
| Q1 2018 | $5.86 billion | 6.44% |
| Q2 2018 | $4.01 billion | 6.73% |
| Q3 2018 | $4.63 billion | 8.9% |
| Q4 2018 | $4.09 billion | 6.5% |
| Q1 2019 | $6.73 billion | 7.98% |
| Q2 2019 | $4.87 billion | 8.4% |
| Q3 2019 | $5.02 billion | 9.33% |
| Q4 2019 | $4.66 billion | 7.27% |
| Q1 2020 | $5.98 billion | 6.51% |
| Q2 2020 | $4.37 billion | 7.5% |
| Q3 2020 | $6.58 billion | 11.03% |
| Q4 2020 | $6.8 billion | 10.05% |
| Q1 2021 | $8.44 billion | 7.57% |
| Q2 2021 | $7.81 billion | 8.71% |
| Q3 2021 | $7.37 billion | 9.05% |
| Q4 2021 | $8.25 billion | 9.9% |
| Q1 2022 | $7.25 billion | 5.85% |
| Q2 2022 | $7.65 billion | 7.86% |
| Q3 2022 | $7.22 billion | 8.71% |
| Q4 2022 | $7.17 billion | 7.96% |
| Q1 2023 | $9.4 billion | 8.02% |
| Q2 2023 | $6.67 billion | 7.03% |
| Q3 2023 | $5.79 billion | 7.08% |
| Q4 2023 | $6.44 billion | 7.2% |
| Q1 2024 | $7.02 billion | 5.87% |
| Q2 2024 | $5.56 billion | 6.13% |
| Q3 2024 | $7.16 billion | 8.35% |
| Q4 2024 | $6.95 billion | 7.32% |
The iPad’s steady revenue contribution highlights its position in the tablet market. Its versatility and integration with the Apple ecosystem make it a popular choice for many consumers. By continuously updating its iPad lineup with new features and capabilities, Apple ensures its sustained relevance in a competitive market.
Source: Apple
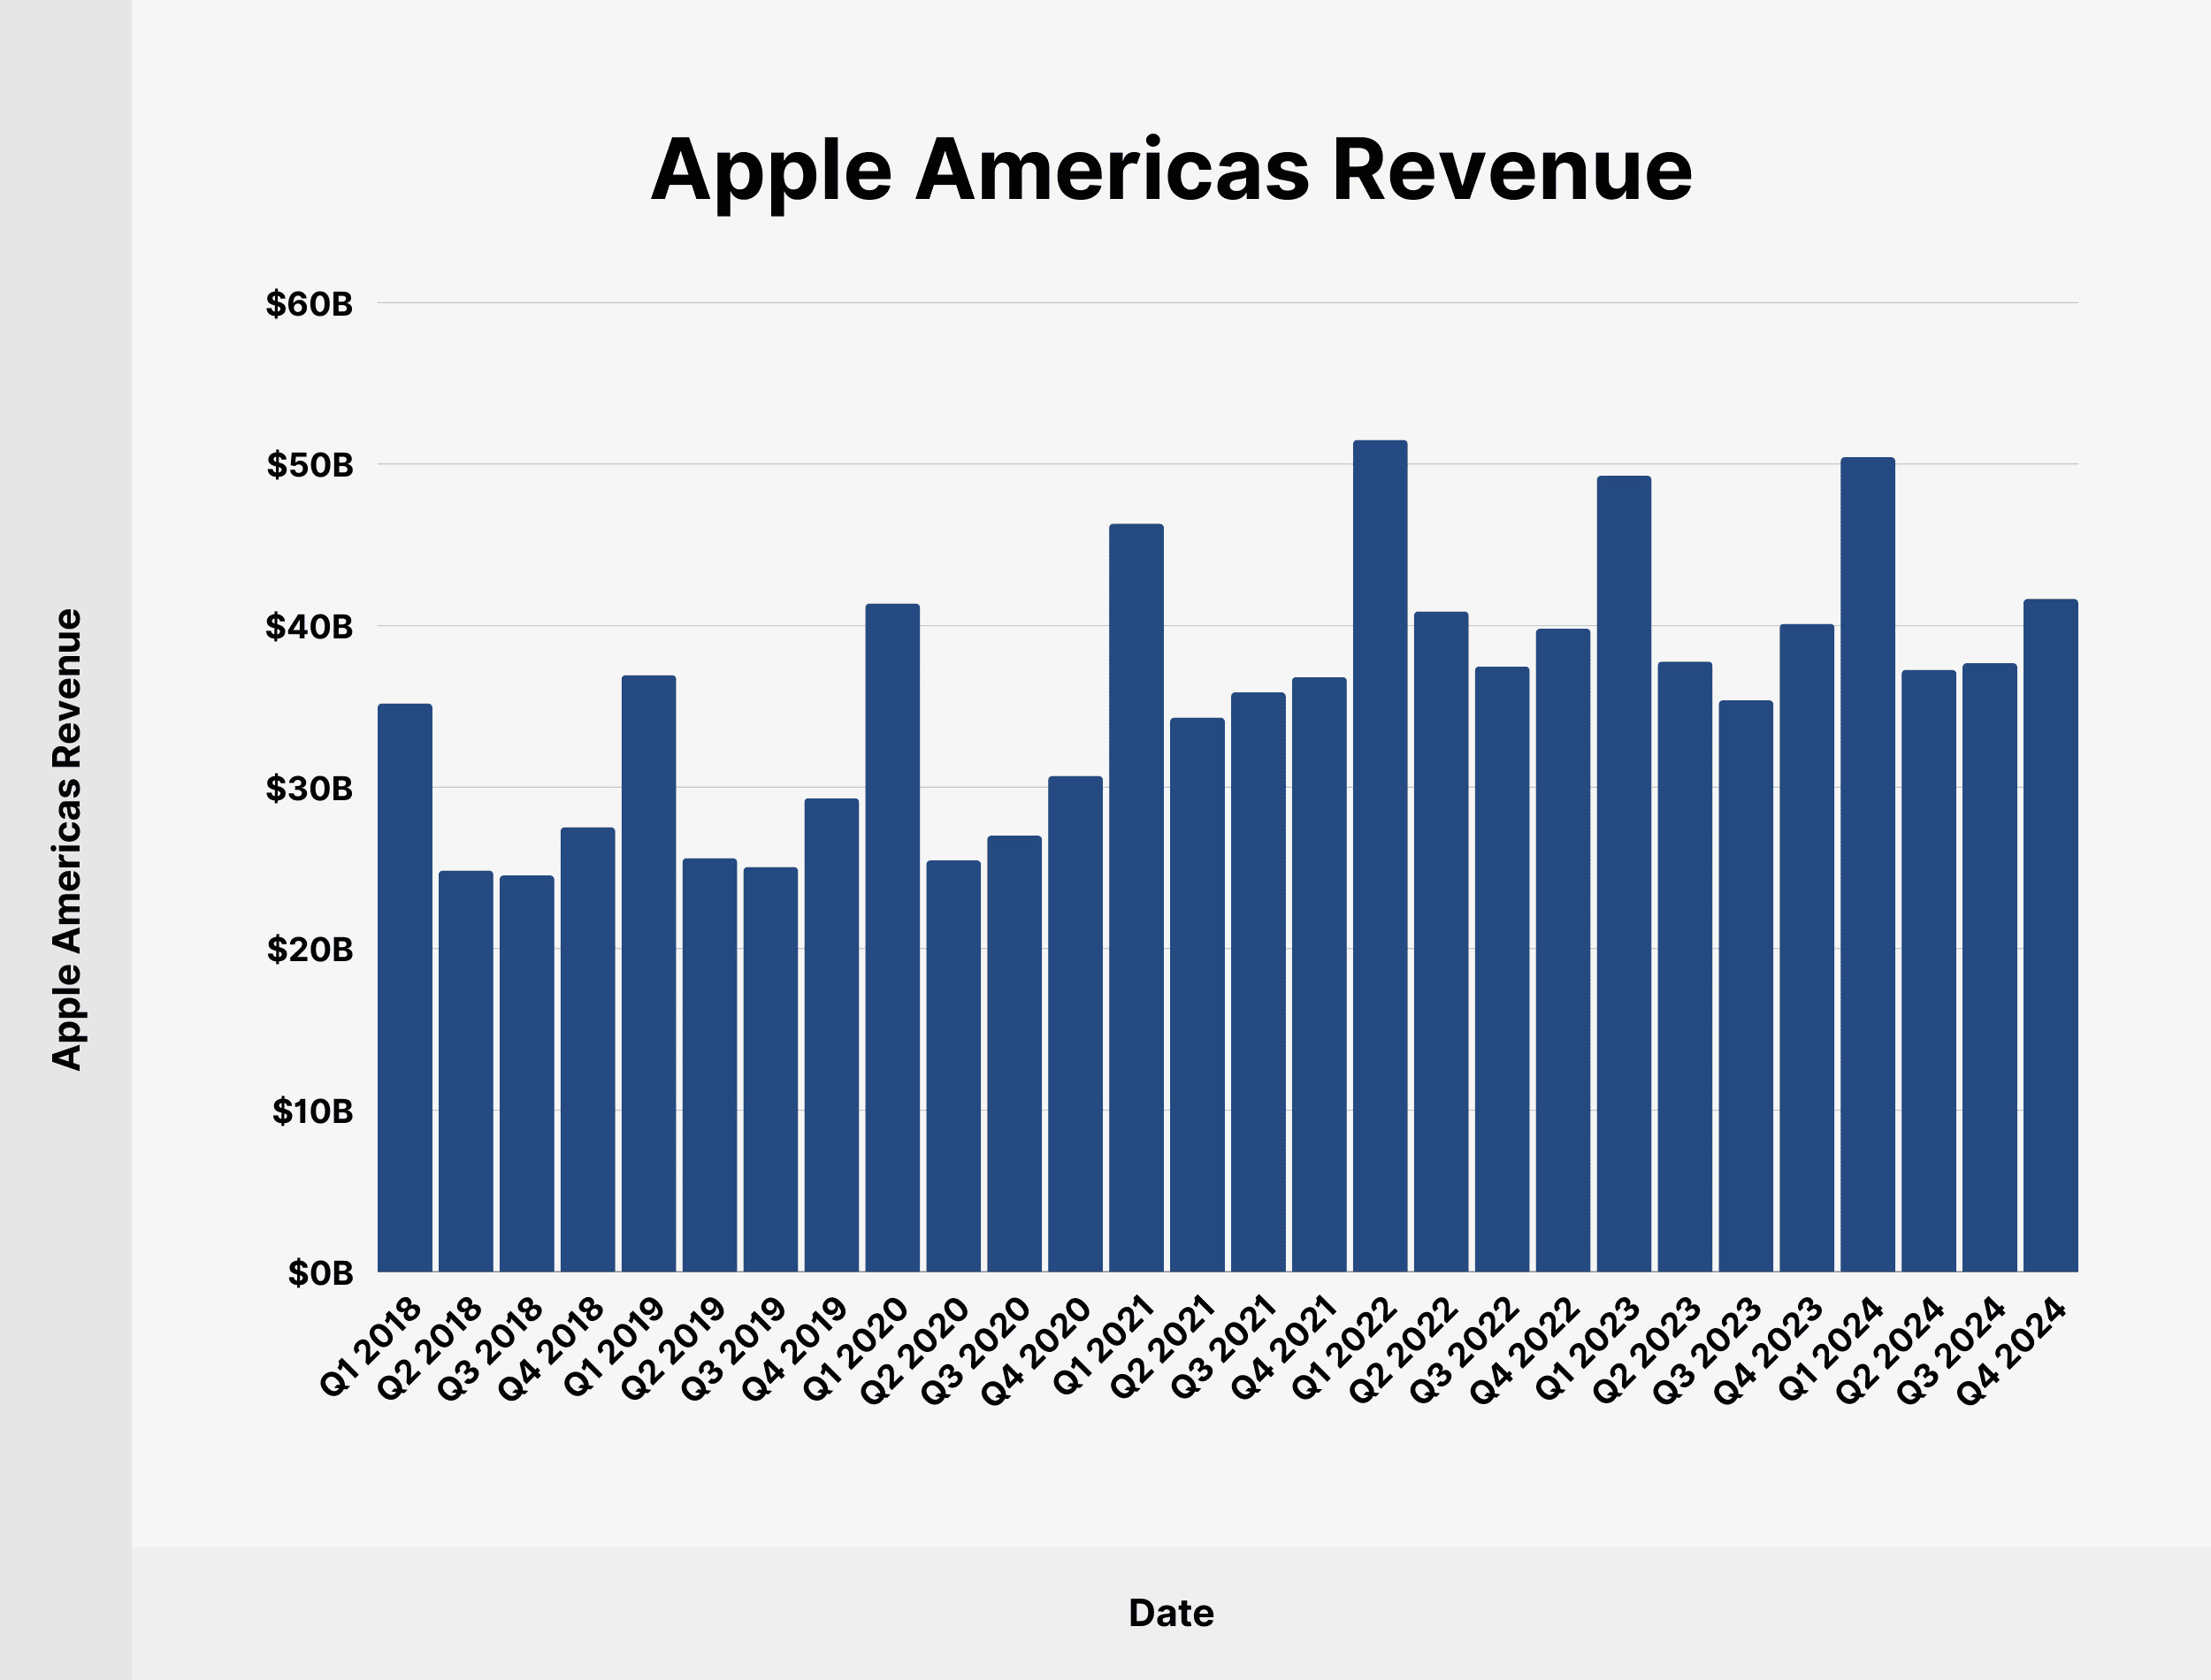
8. How Much Revenue Does Apple Make in the Americas?
In Q4 2024, Apple generated $41.66 billion in revenue from the Americas region, representing 43.89% of Apple’s total revenue. The Americas remain a key market for Apple, contributing significantly to its overall financial success. The region’s strong consumer base and purchasing power make it a critical area for Apple’s sales and growth.
 Apple Americas Revenue
Here’s a detailed breakdown of Apple’s quarterly revenue in the Americas since Q1 2018:
| Date | Apple Americas Revenue | Share of Total Apple Revenue |
|---|---|---|
| Q1 2018 | $35.19 billion | 39.9% |
| Q2 2018 | $24.84 billion | 40.63% |
| Q3 2018 | $24.54 billion | 46.08% |
| Q4 2018 | $27.52 billion | 43.75% |
| Q1 2019 | $36.94 billion | 43.81% |
| Q2 2019 | $25.6 billion | 44.12% |
| Q3 2019 | $25.06 billion | 46.56% |
| Q4 2019 | $29.32 billion | 45.79% |
| Q1 2020 | $41.37 billion | 45.05% |
| Q2 2020 | $25.47 billion | 43.68% |
| Q3 2020 | $27 billion | 45.27% |
| Q4 2020 | $30.7 billion | 45.4% |
| Q1 2021 | $46.31 billion | 41.56% |
| Q2 2021 | $34.31 billion | 38.29% |
| Q3 2021 | $35.87 billion | 44.04% |
| Q4 2021 | $36.82 billion | 44.17% |
| Q1 2022 | $51.5 billion | 41.55% |
| Q2 2022 | $40.88 billion | 42.03% |
| Q3 2022 | $37.47 billion | 45.17% |
| Q4 2022 | $39.81 billion | 44.16% |
| Q1 2023 | $49.28 billion | 42.06% |
| Q2 2023 | $37.78 billion | 39.84% |
| Q3 2023 | $35.38 billion | 43.26% |
| Q4 2023 | $40.12 billion | 44.82% |
| Q1 2024 | $50.43 billion | 42.17% |
| Q2 2024 | $37.27 billion | 41.07% |
| Q3 2024 | $37.68 billion | 43.93% |
| Q4 2024 | $41.66 billion | 43.89% |
The sustained strong performance in the Americas highlights the region’s importance to Apple. With ongoing investments in retail and marketing, Apple continues to strengthen its presence and appeal to consumers in the Americas. This region remains a cornerstone of Apple’s global strategy.
9. How Much Revenue Does Apple Make in Europe?
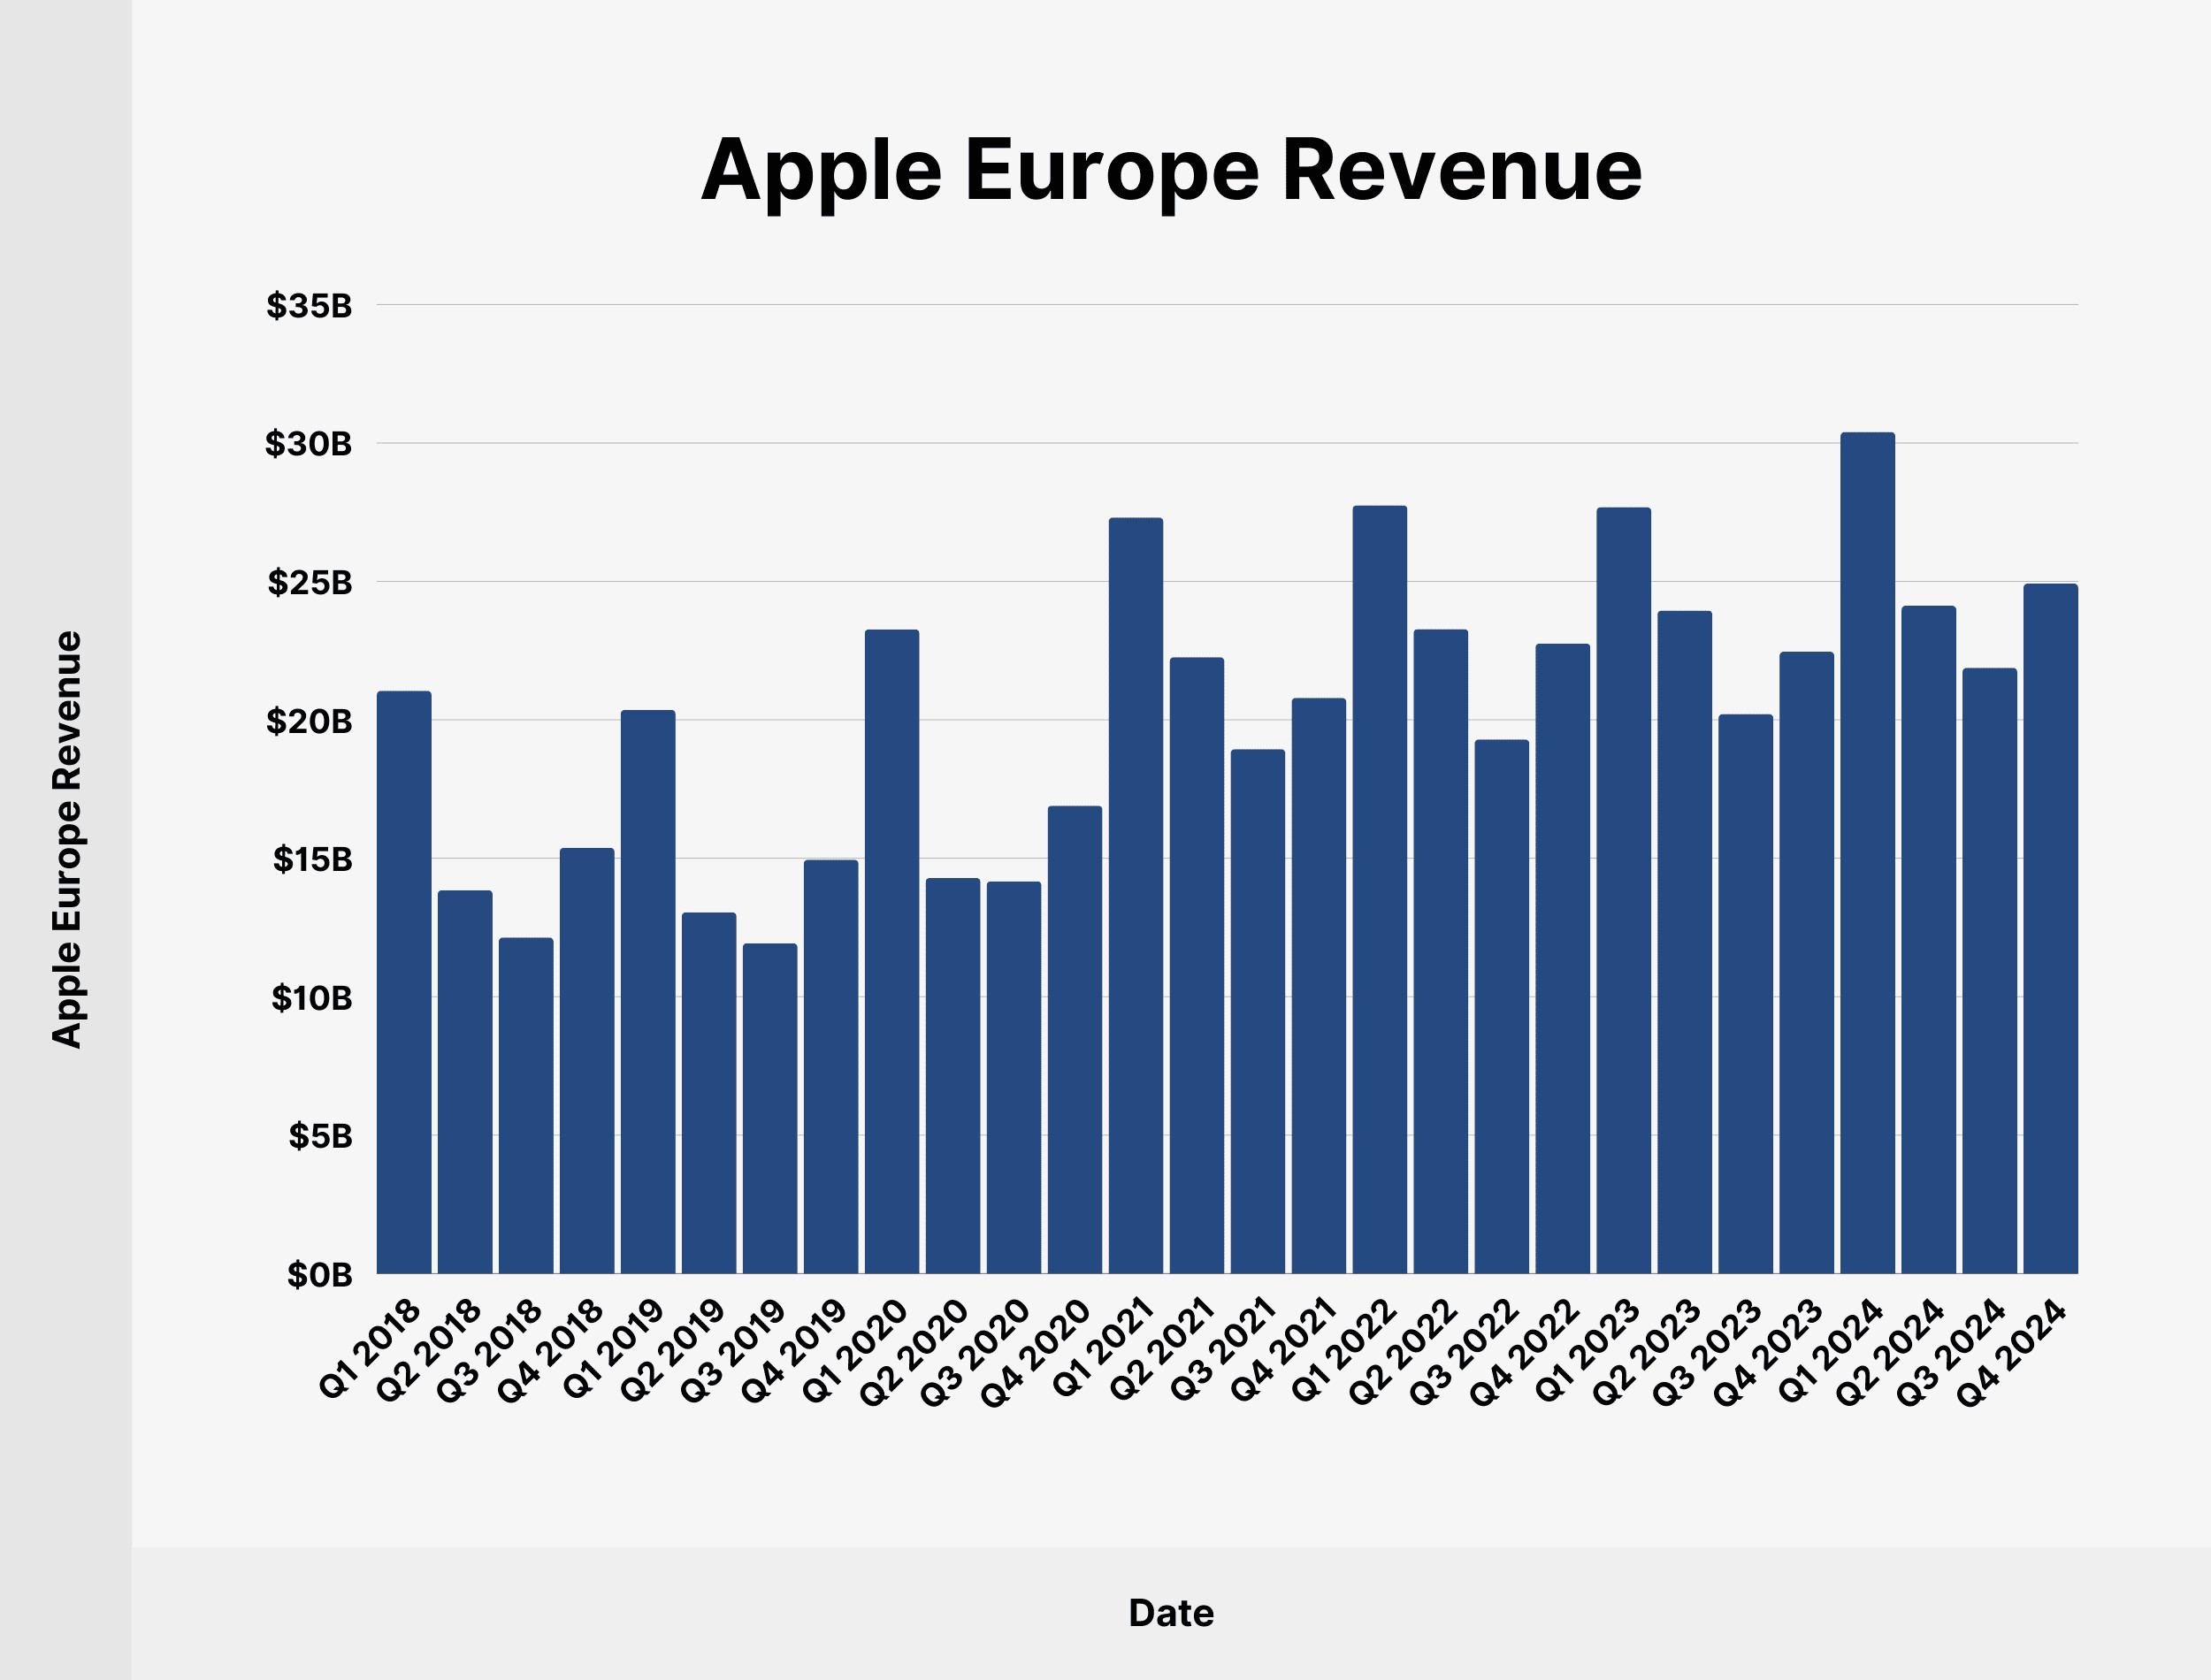
In Q4 2024, Apple’s revenue in Europe amounted to $24.92 billion, accounting for 26.25% of the total quarterly revenue. Europe is the second-largest market for Apple, demonstrating its widespread appeal and robust sales in the region. The strong revenue figures reflect Apple’s successful strategies in engaging with European consumers and expanding its market presence.
 Apple Europe Revenue
Here’s a breakdown of Apple’s quarterly revenue from the European market since Q1 2018:
| Date | Apple Europe Revenue | Share of Total Apple Revenue |
|---|---|---|
| Q1 2018 | $21.05 billion | 23.85% |
| Q2 2018 | $13.85 billion | 22.65% |
| Q3 2018 | $12.14 billion | 22.79% |
| Q4 2018 | $15.38 billion | 24.45% |
| Q1 2019 | $20.36 billion | 24.15% |
| Q2 2019 | $13.05 billion | 22.5% |
| Q3 2019 | $11.93 billion | 22.16% |
| Q4 2019 | $14.95 billion | 23.34% |
| Q1 2020 | $23.27 billion | 25.35% |
| Q2 2020 | $14.29 billion | 24.51% |
| Q3 2020 | $14.17 billion | 23.75% |
| Q4 2020 | $16.9 billion | 25% |
| Q1 2021 | $27.31 billion | 24.5% |
| Q2 2021 | $22.26 billion | 24.85% |
| Q3 2021 | $18.94 billion | 23.26% |
| Q4 2021 | $20.79 billion | 24.94% |
| Q1 2022 | $27.75 billion | 24% |
| Q2 2022 | $23.28 billion | 23.94% |
| Q3 2022 | $19.29 billion | 23.25% |
| Q4 2022 | $22.76 billion | 25.29% |
| Q1 2023 | $27.68 billion | 23.63% |
| Q2 2023 | $23.95 billion | 25.25% |
| Q3 2023 | $20.21 billion | 24.7% |
| Q4 2023 | $22.46 billion | 25.1% |
| Q1 2024 | $30.4 billion | 25.42% |
| Q2 2024 | $24.12 billion | 26.58% |
| Q3 2024 | $21.88 billion | 25.51% |
| Q4 2024 | $24.92 billion | 26.25% |
Apple’s success in Europe is supported by a combination of strong product demand, effective marketing, and a robust retail presence. The region’s diverse markets and consumer preferences require tailored strategies, which Apple has successfully implemented. This ongoing success highlights the importance of Europe in Apple’s global financial strategy.
10. How Much Revenue Does Apple Make in Greater China?
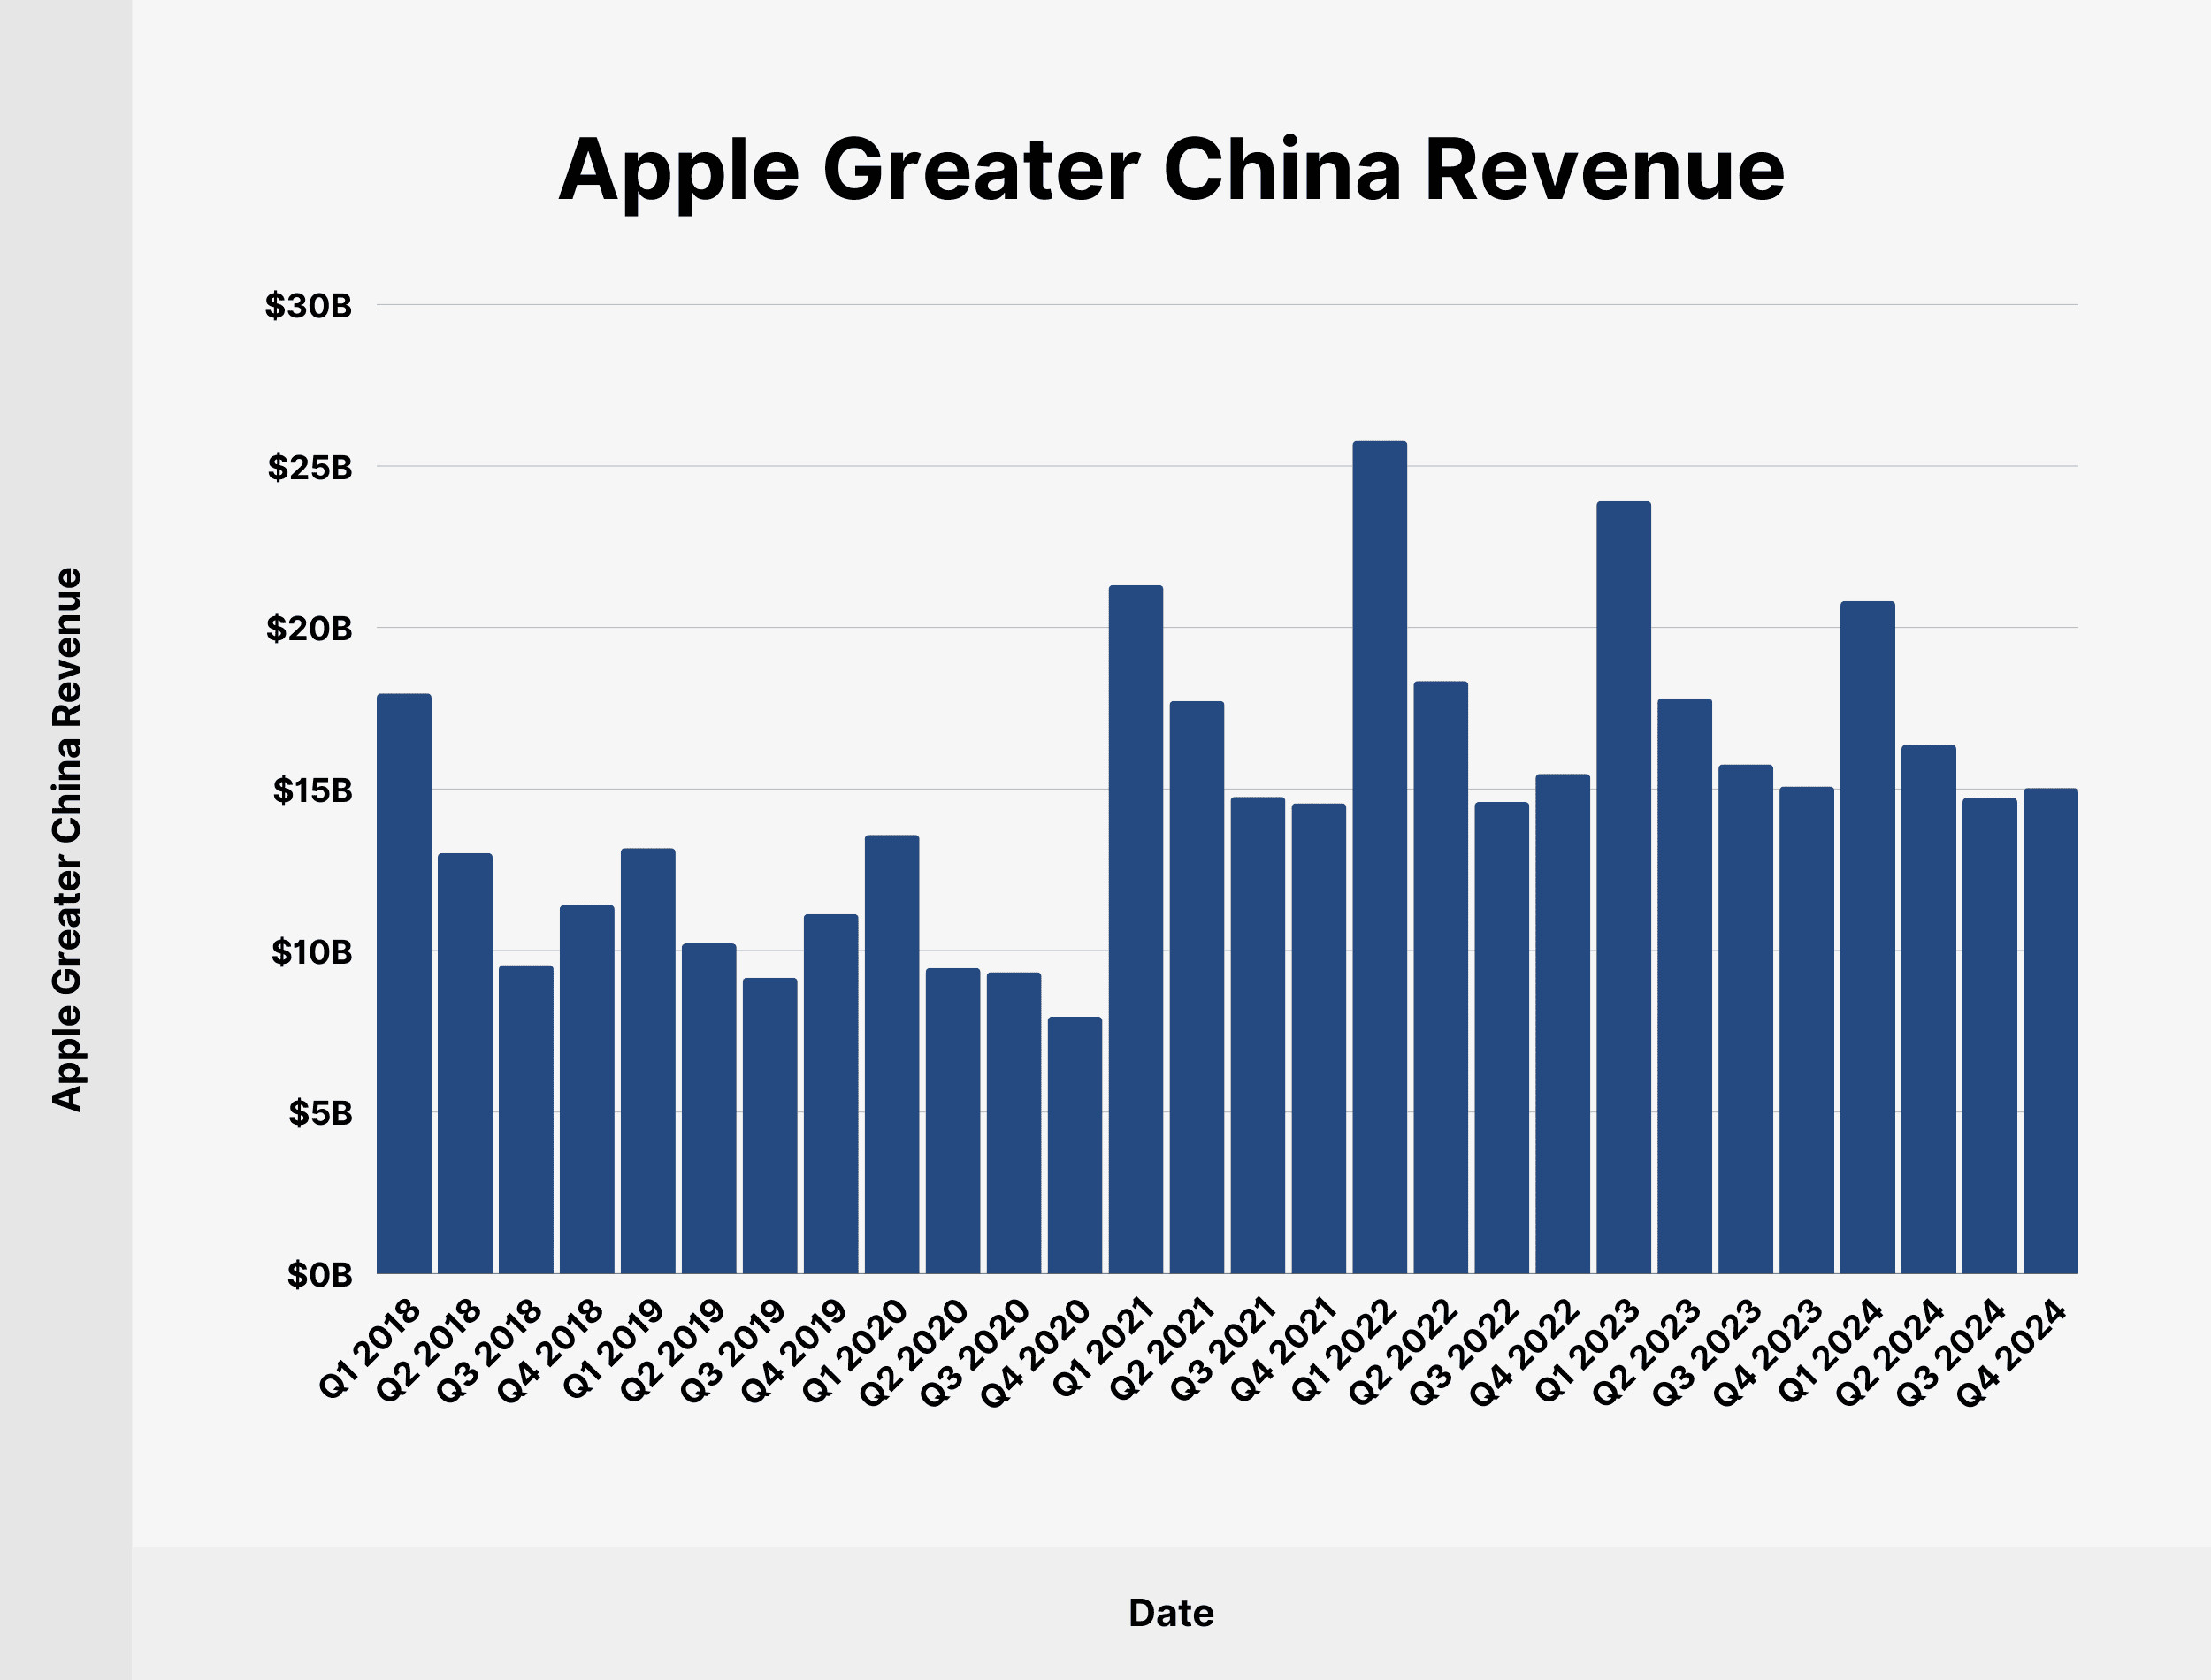
In Q4 2024, Apple’s revenue in Greater China reached $15.03 billion, representing 15.83% of the total quarterly revenue. Despite market competition, Greater China remains a vital region for Apple, contributing significantly to its global sales.
 Apple Greater China Revenue
Here’s a table with Apple’s Greater China revenue since Q1 2018:
| Date | Apple Greater China Revenue | Share of Total Apple Revenue |
|---|---|---|
| Q1 2018 | $17.96 billion | 20.34% |
| Q2 2018 | $13.02 billion | 21.3% |
| Q3 2018 | $9.55 billion | 17.93% |
| Q4 2018 | $11.41 billion | 18.14 |