How Much Money Does Apple Make In A Year? Apple’s financial performance is a key indicator of its strength in the technology sector, and at money-central.com, we provide a detailed look at their annual revenue, offering insights into the company’s financial health. In 2024, Apple reported an annual revenue of $391.04 billion, making it one of the most valuable companies in the world. This article explores Apple’s revenue streams, market share, and other financial statistics, giving you a comprehensive understanding of Apple’s financial success, which includes capital, cash flow and investment.
1. What Is Apple’s Annual Revenue?
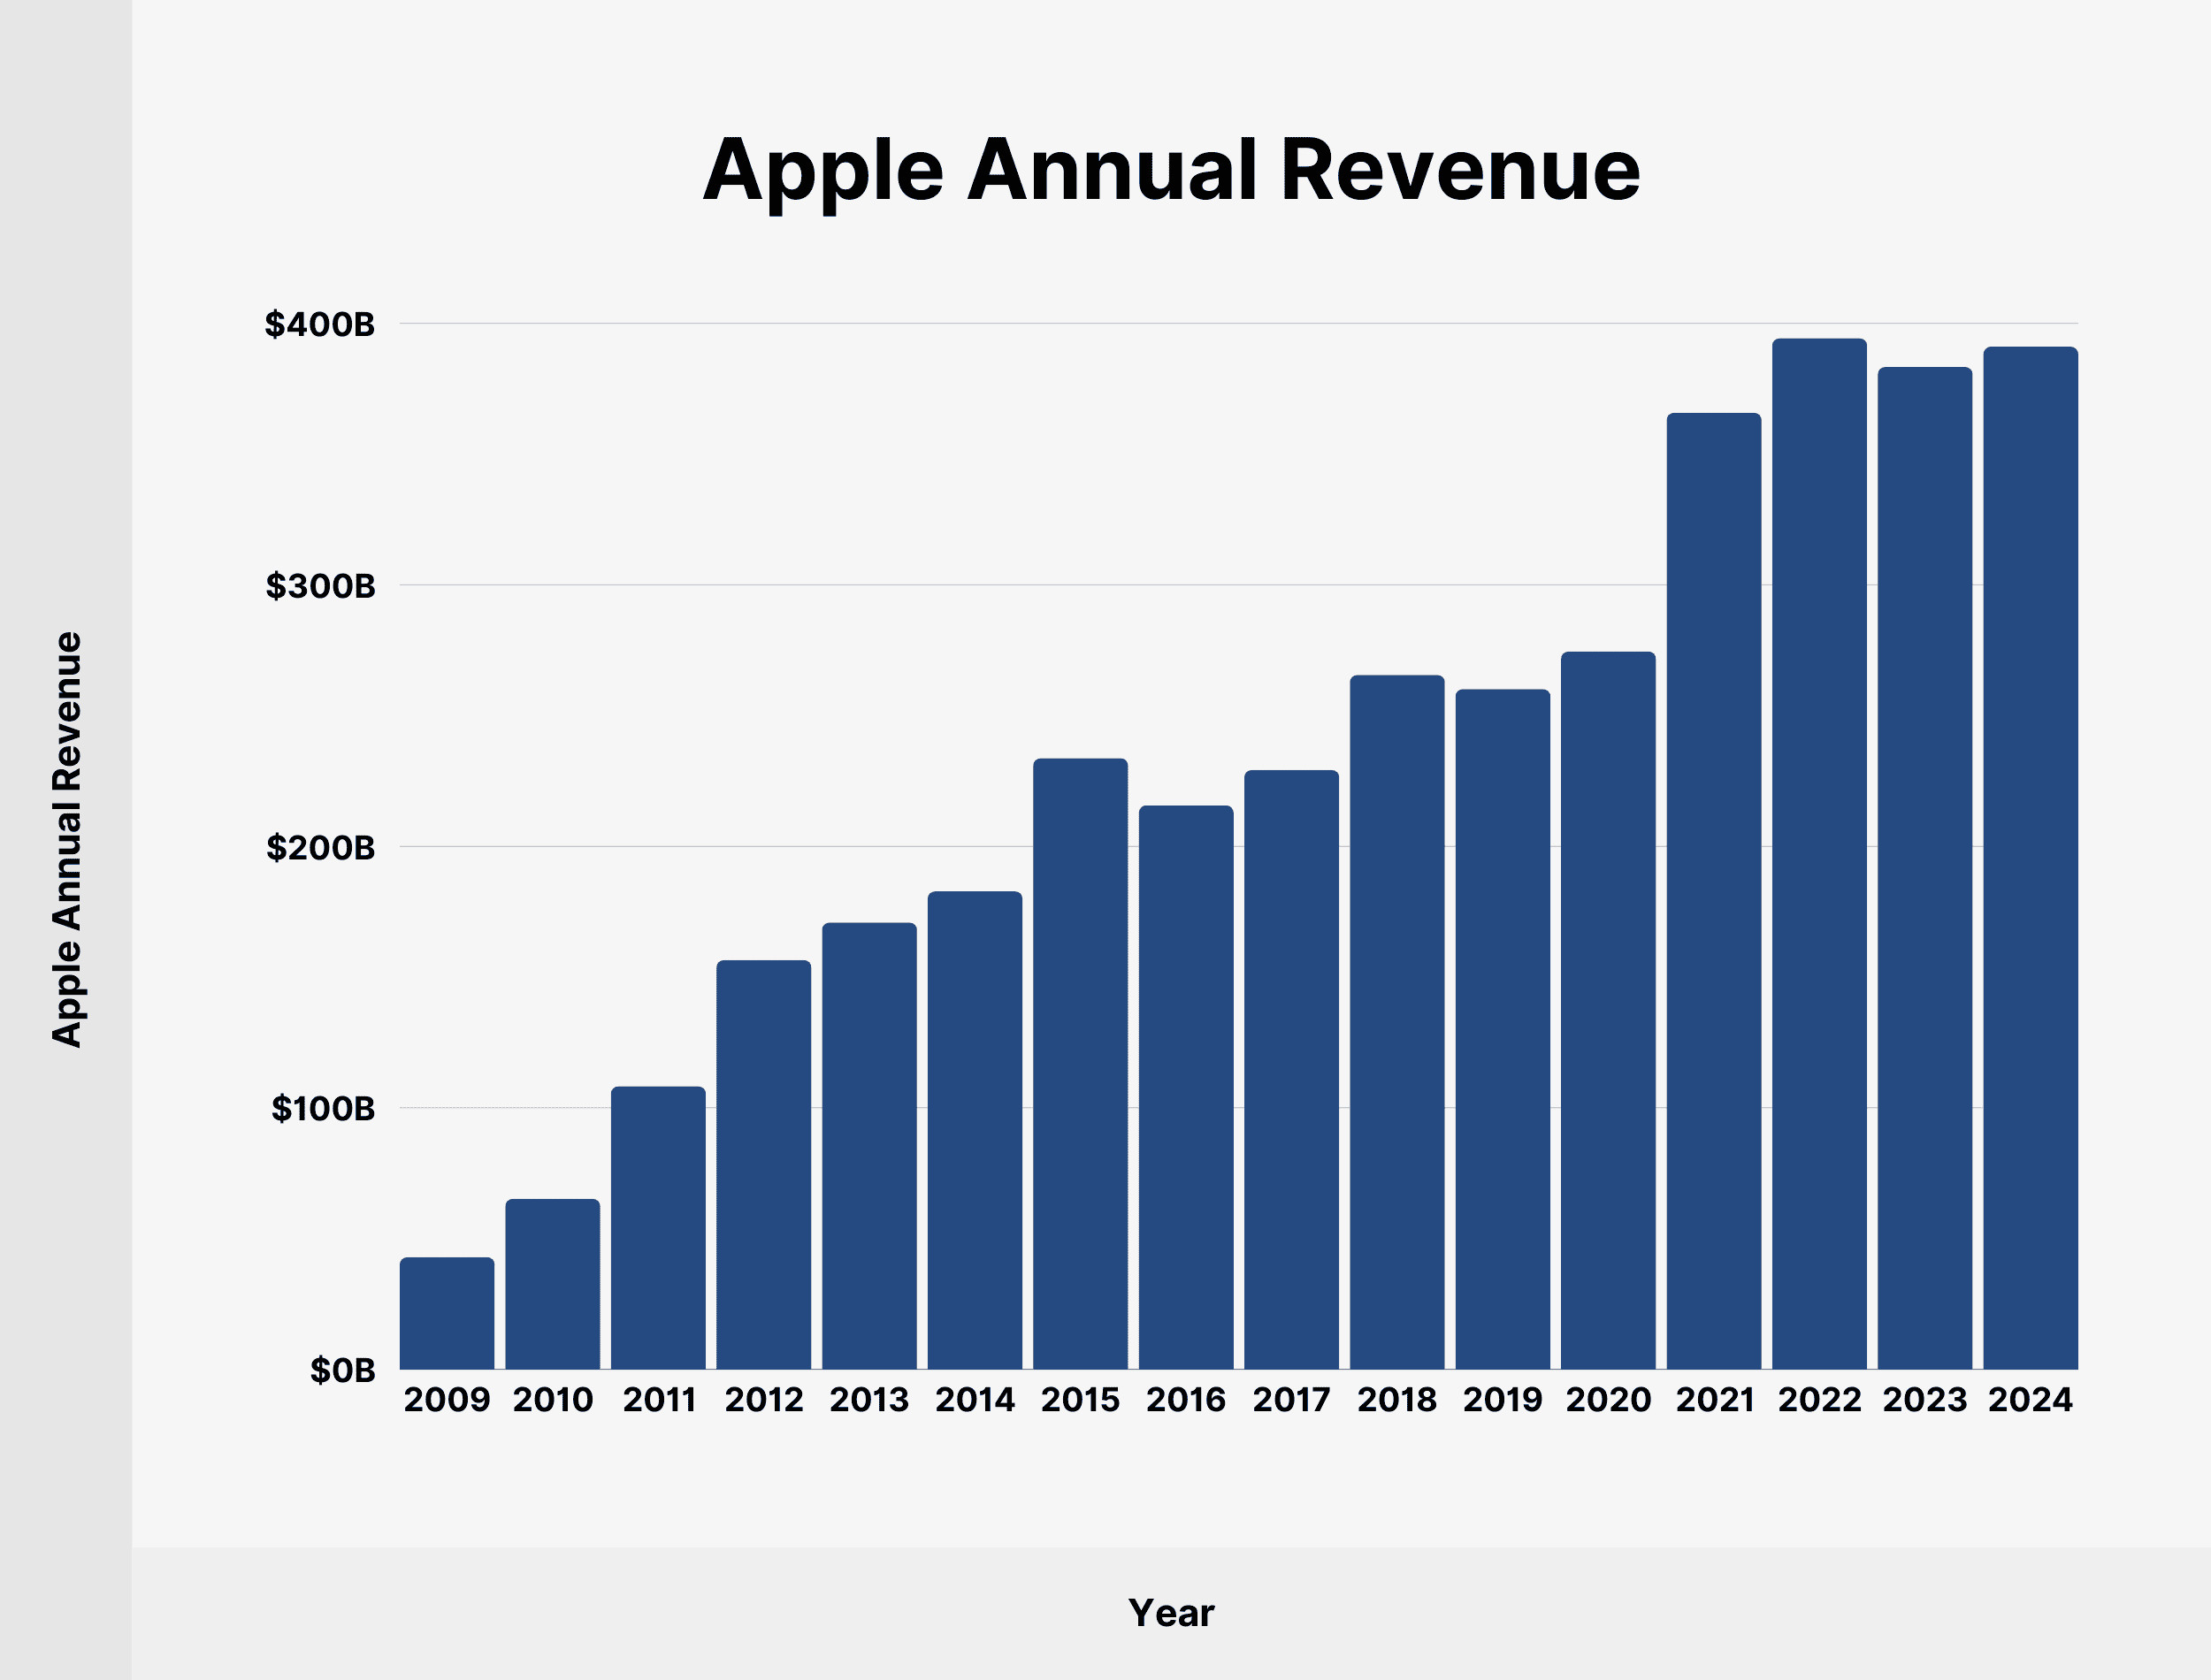
Apple’s annual revenue for 2024 was $391.04 billion. While this figure is impressive, it represents a 2.02% decrease compared to the previous fiscal year. Despite this slight dip, Apple remains a financial powerhouse, consistently generating substantial revenue each year.
Here is a breakdown of Apple’s annual revenue since 2009:
| Year | Apple Annual Revenue |
|---|---|
| 2009 | $42.91 billion |
| 2010 | $65.23 billion |
| 2011 | $108.25 billion |
| 2012 | $156.51 billion |
| 2013 | $170.91 billion |
| 2014 | $182.8 billion |
| 2015 | $233.72 billion |
| 2016 | $215.64 billion |
| 2017 | $229.23 billion |
| 2018 | $265.6 billion |
| 2019 | $260.17 billion |
| 2020 | $274.52 billion |
| 2021 | $365.82 billion |
| 2022 | $394.33 billion |
| 2023 | $383.29 billion |
| 2024 | $391.04 billion |
This consistent growth underscores Apple’s ability to innovate and maintain its market position.
 Apple Annual Revenue
2. What Is Apple’s Quarterly Revenue?
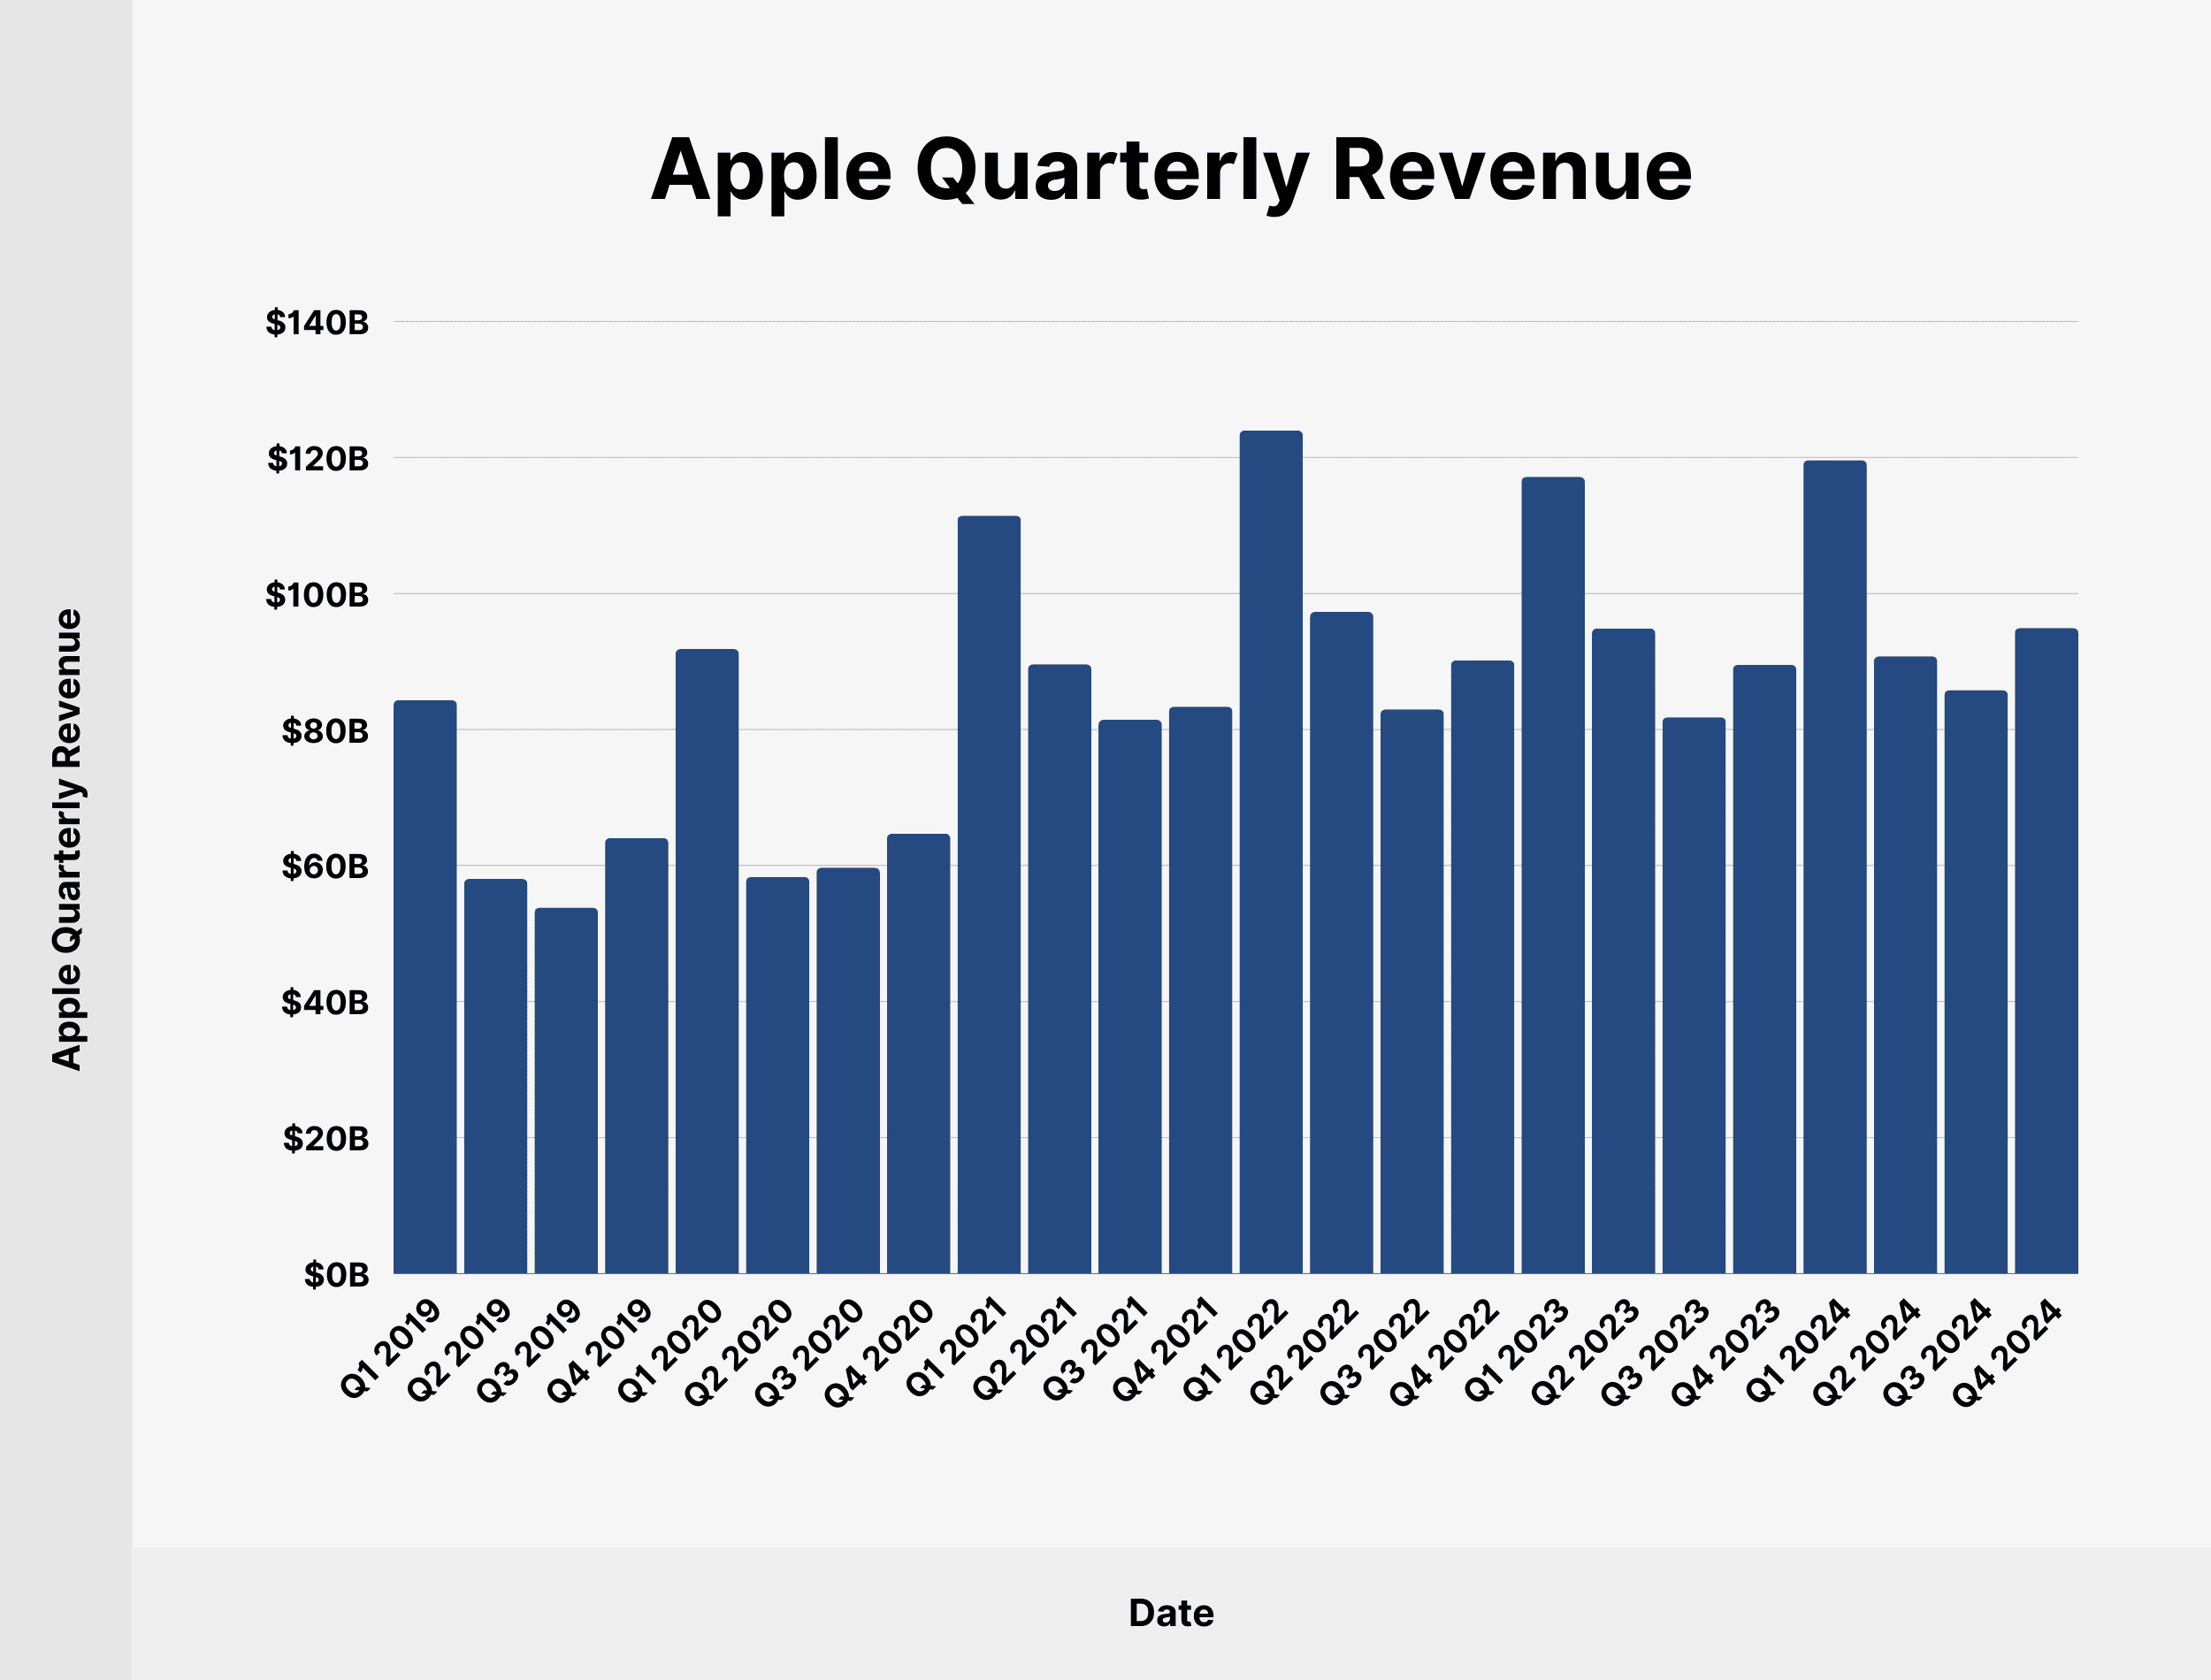
In the fourth quarter of 2024, Apple’s quarterly revenue reached $94.93 billion, marking a 6.07% increase year-over-year. This quarterly performance highlights Apple’s ability to generate significant income consistently throughout the year.
Below is a detailed look at Apple’s quarterly revenue since Q1 2019:
| Date | Apple Quarterly Revenue |
|---|---|
| Q1 2019 | $84.31 billion |
| Q2 2019 | $58.02 billion |
| Q3 2019 | $53.81 billion |
| Q4 2019 | $64.04 billion |
| Q1 2020 | $91.82 billion |
| Q2 2020 | $58.31 billion |
| Q3 2020 | $59.69 billion |
| Q4 2020 | $64.7 billion |
| Q1 2021 | $111.44 billion |
| Q2 2021 | $89.58 billion |
| Q3 2021 | $81.43 billion |
| Q4 2021 | $83.36 billion |
| Q1 2022 | $123.95 billion |
| Q2 2022 | $97.28 billion |
| Q3 2022 | $82.96 billion |
| Q4 2022 | $90.15 billion |
| Q1 2023 | $117.15 billion |
| Q2 2023 | $94.84 billion |
| Q3 2023 | $81.8 billion |
| Q4 2023 | $89.5 billion |
| Q1 2024 | $119.58 billion |
| Q2 2024 | $90.75 billion |
| Q3 2024 | $85.78 billion |
| Q4 2024 | $94.93 billion |
 Apple Quarterly Revenue
3. How Much Does Apple Make From iPhone Sales?
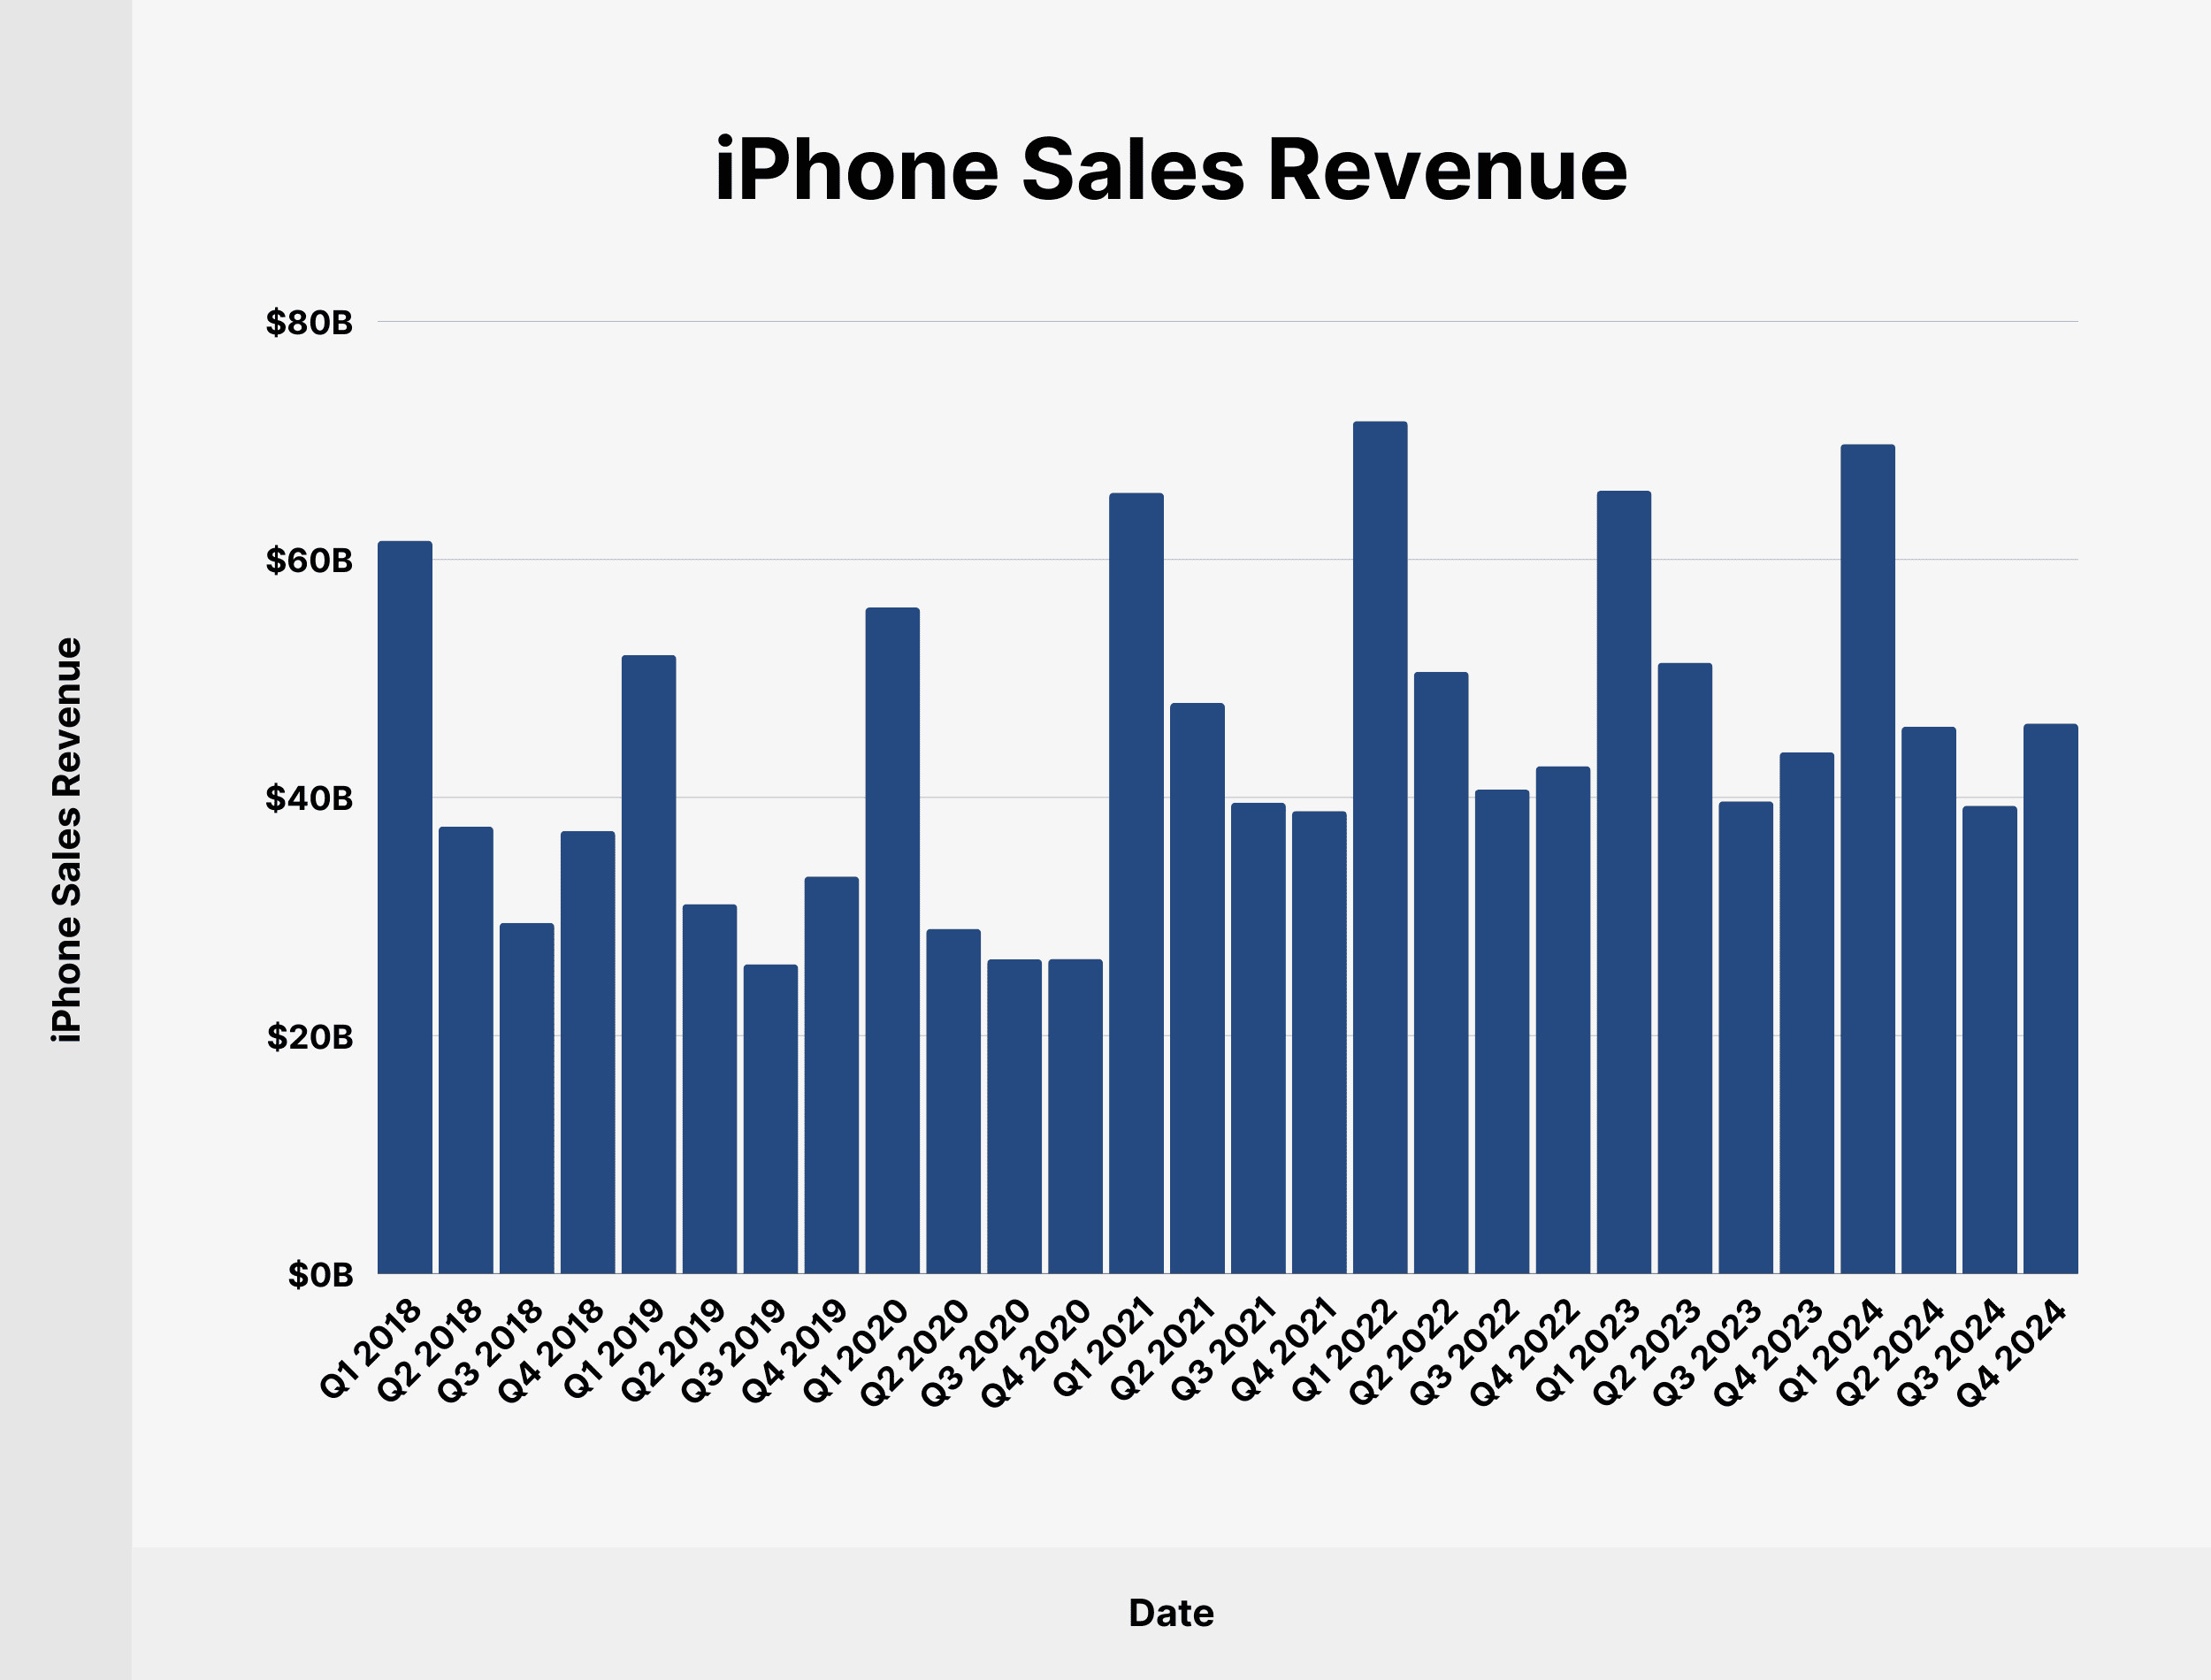
iPhone sales are a significant revenue stream for Apple. In Q4 2024, iPhone sales accounted for $46.22 billion, representing 48.69% of Apple’s total quarterly revenue. The iPhone remains Apple’s largest category by sales.
The following table shows a detailed breakdown of iPhone sales since Q1 2018, including the share of total Apple revenue:
| Date | iPhone Sales | Share of Total Apple Revenue |
|---|---|---|
| Q1 2018 | $61.58 billion | 69.74% |
| Q2 2018 | $37.56 billion | 62.21% |
| Q3 2018 | $29.47 billion | 56.15% |
| Q4 2018 | $37.19 billion | 59.12% |
| Q1 2019 | $51.98 billion | 61.66% |
| Q2 2019 | $31.05 billion | 53.52% |
| Q3 2019 | $25.99 billion | 48.29% |
| Q4 2019 | $33.36 billion | 52.1% |
| Q1 2020 | $55.96 billion | 60.9% |
| Q2 2020 | $28.96 billion | 49.7% |
| Q3 2020 | $26.42 billion | 44.26% |
| Q4 2020 | $26.44 billion | 40.9% |
| Q1 2021 | $65.6 billion | 58.86% |
| Q2 2021 | $47.94 billion | 53.51% |
| Q3 2021 | $39.57 billion | 48.59% |
| Q4 2021 | $38.87 billion | 46.63% |
| Q1 2022 | $71.63 billion | 57.8% |
| Q2 2022 | $50.57 billion | 51.99% |
| Q3 2022 | $40.67 billion | 49.02% |
| Q4 2022 | $42.63 billion | 47.29% |
| Q1 2023 | $65.78 billion | 56.14% |
| Q2 2023 | $51.33 billion | 54.13% |
| Q3 2023 | $39.67 billion | 48.5% |
| Q4 2023 | $43.81 billion | 48.95% |
| Q1 2024 | $69.7 billion | 58.29% |
| Q2 2024 | $45.96 billion | 50.64% |
| Q3 2024 | $39.3 billion | 45.82% |
| Q4 2024 | $46.22 billion | 48.69% |
 iPhone Sales Revenue
4. How Much Revenue Does Apple’s Service Business Generate?
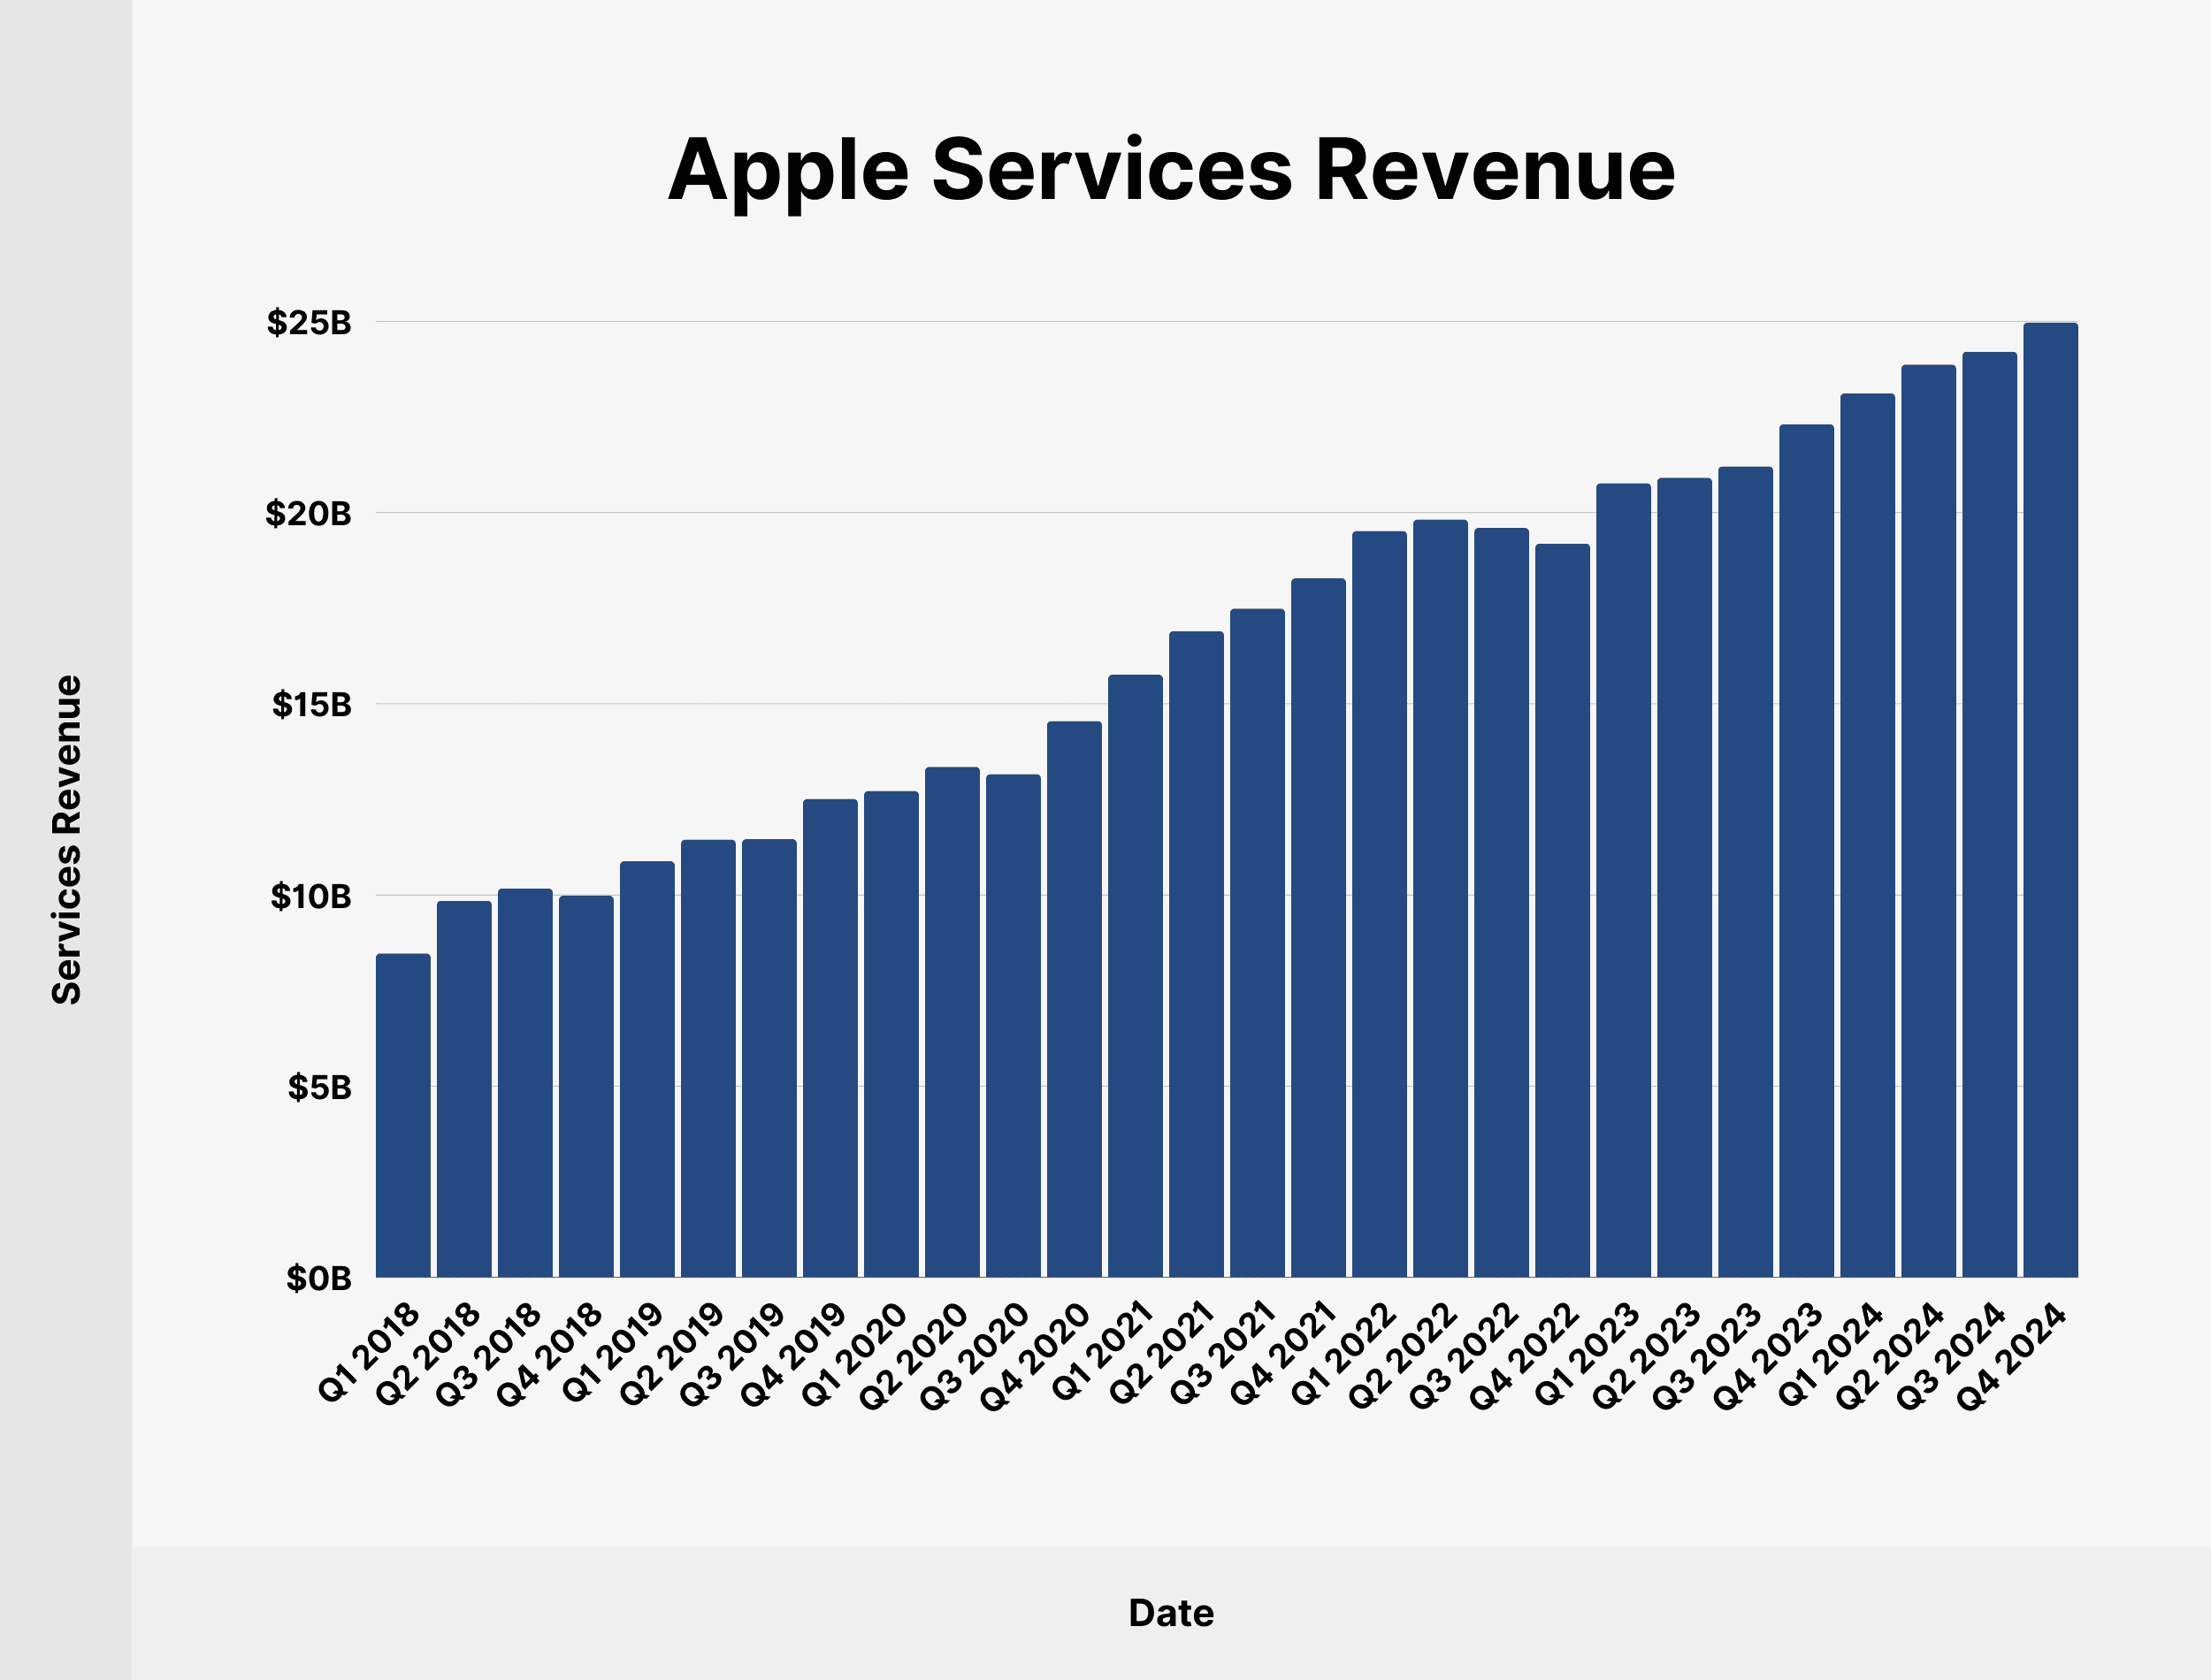
Apple’s service business, which includes revenue from the App Store, iTunes Store, AppleCare, Apple Pay, and other services, is the second-largest category. In Q4 2024, services revenue amounted to $24.97 billion, accounting for 26.31% of total quarterly revenue.
Here’s a chart of Apple’s services revenue since Q1 2018:
| Date | Services Revenue | Share of Total Apple Revenue |
|---|---|---|
| Q1 2018 | $8.47 billion | 9.59% |
| Q2 2018 | $9.85 billion | 15.03% |
| Q3 2018 | $10.17 billion | 17.93% |
| Q4 2018 | $9.98 billion | 15.87% |
| Q1 2019 | $10.88 billion | 12.9% |
| Q2 2019 | $11.45 billion | 19.74% |
| Q3 2019 | $11.46 billion | 21.29% |
| Q4 2019 | $12.51 billion | 19.54% |
| Q1 2020 | $12.72 billion | 13.85% |
| Q2 2020 | $13.35 billion | 22.89% |
| Q3 2020 | $13.16 billion | 22.04% |
| Q4 2020 | $14.55 billion | 22.5% |
| Q1 2021 | $15.76 billion | 14.14% |
| Q2 2021 | $16.9 billion | 18.87% |
| Q3 2021 | $17.49 billion | 21.47% |
| Q4 2021 | $18.28 billion | 21.93% |
| Q1 2022 | $19.52 billion | 15.76% |
| Q2 2022 | $19.82 billion | 20.37% |
| Q3 2022 | $19.6 billion | 23.63% |
| Q4 2022 | $19.19 billion | 21.28% |
| Q1 2023 | $20.77 billion | 17.73% |
| Q2 2023 | $20.91 billion | 22.05% |
| Q3 2023 | $21.21 billion | 25.93% |
| Q4 2023 | $22.31 billion | 24.93% |
| Q1 2024 | $23.12 billion | 19.33% |
| Q2 2024 | $23.87 billion | 26.3% |
| Q3 2024 | $24.21 billion | 28.23% |
| Q4 2024 | $24.97 billion | 26.31% |
 Apple Services Revenue
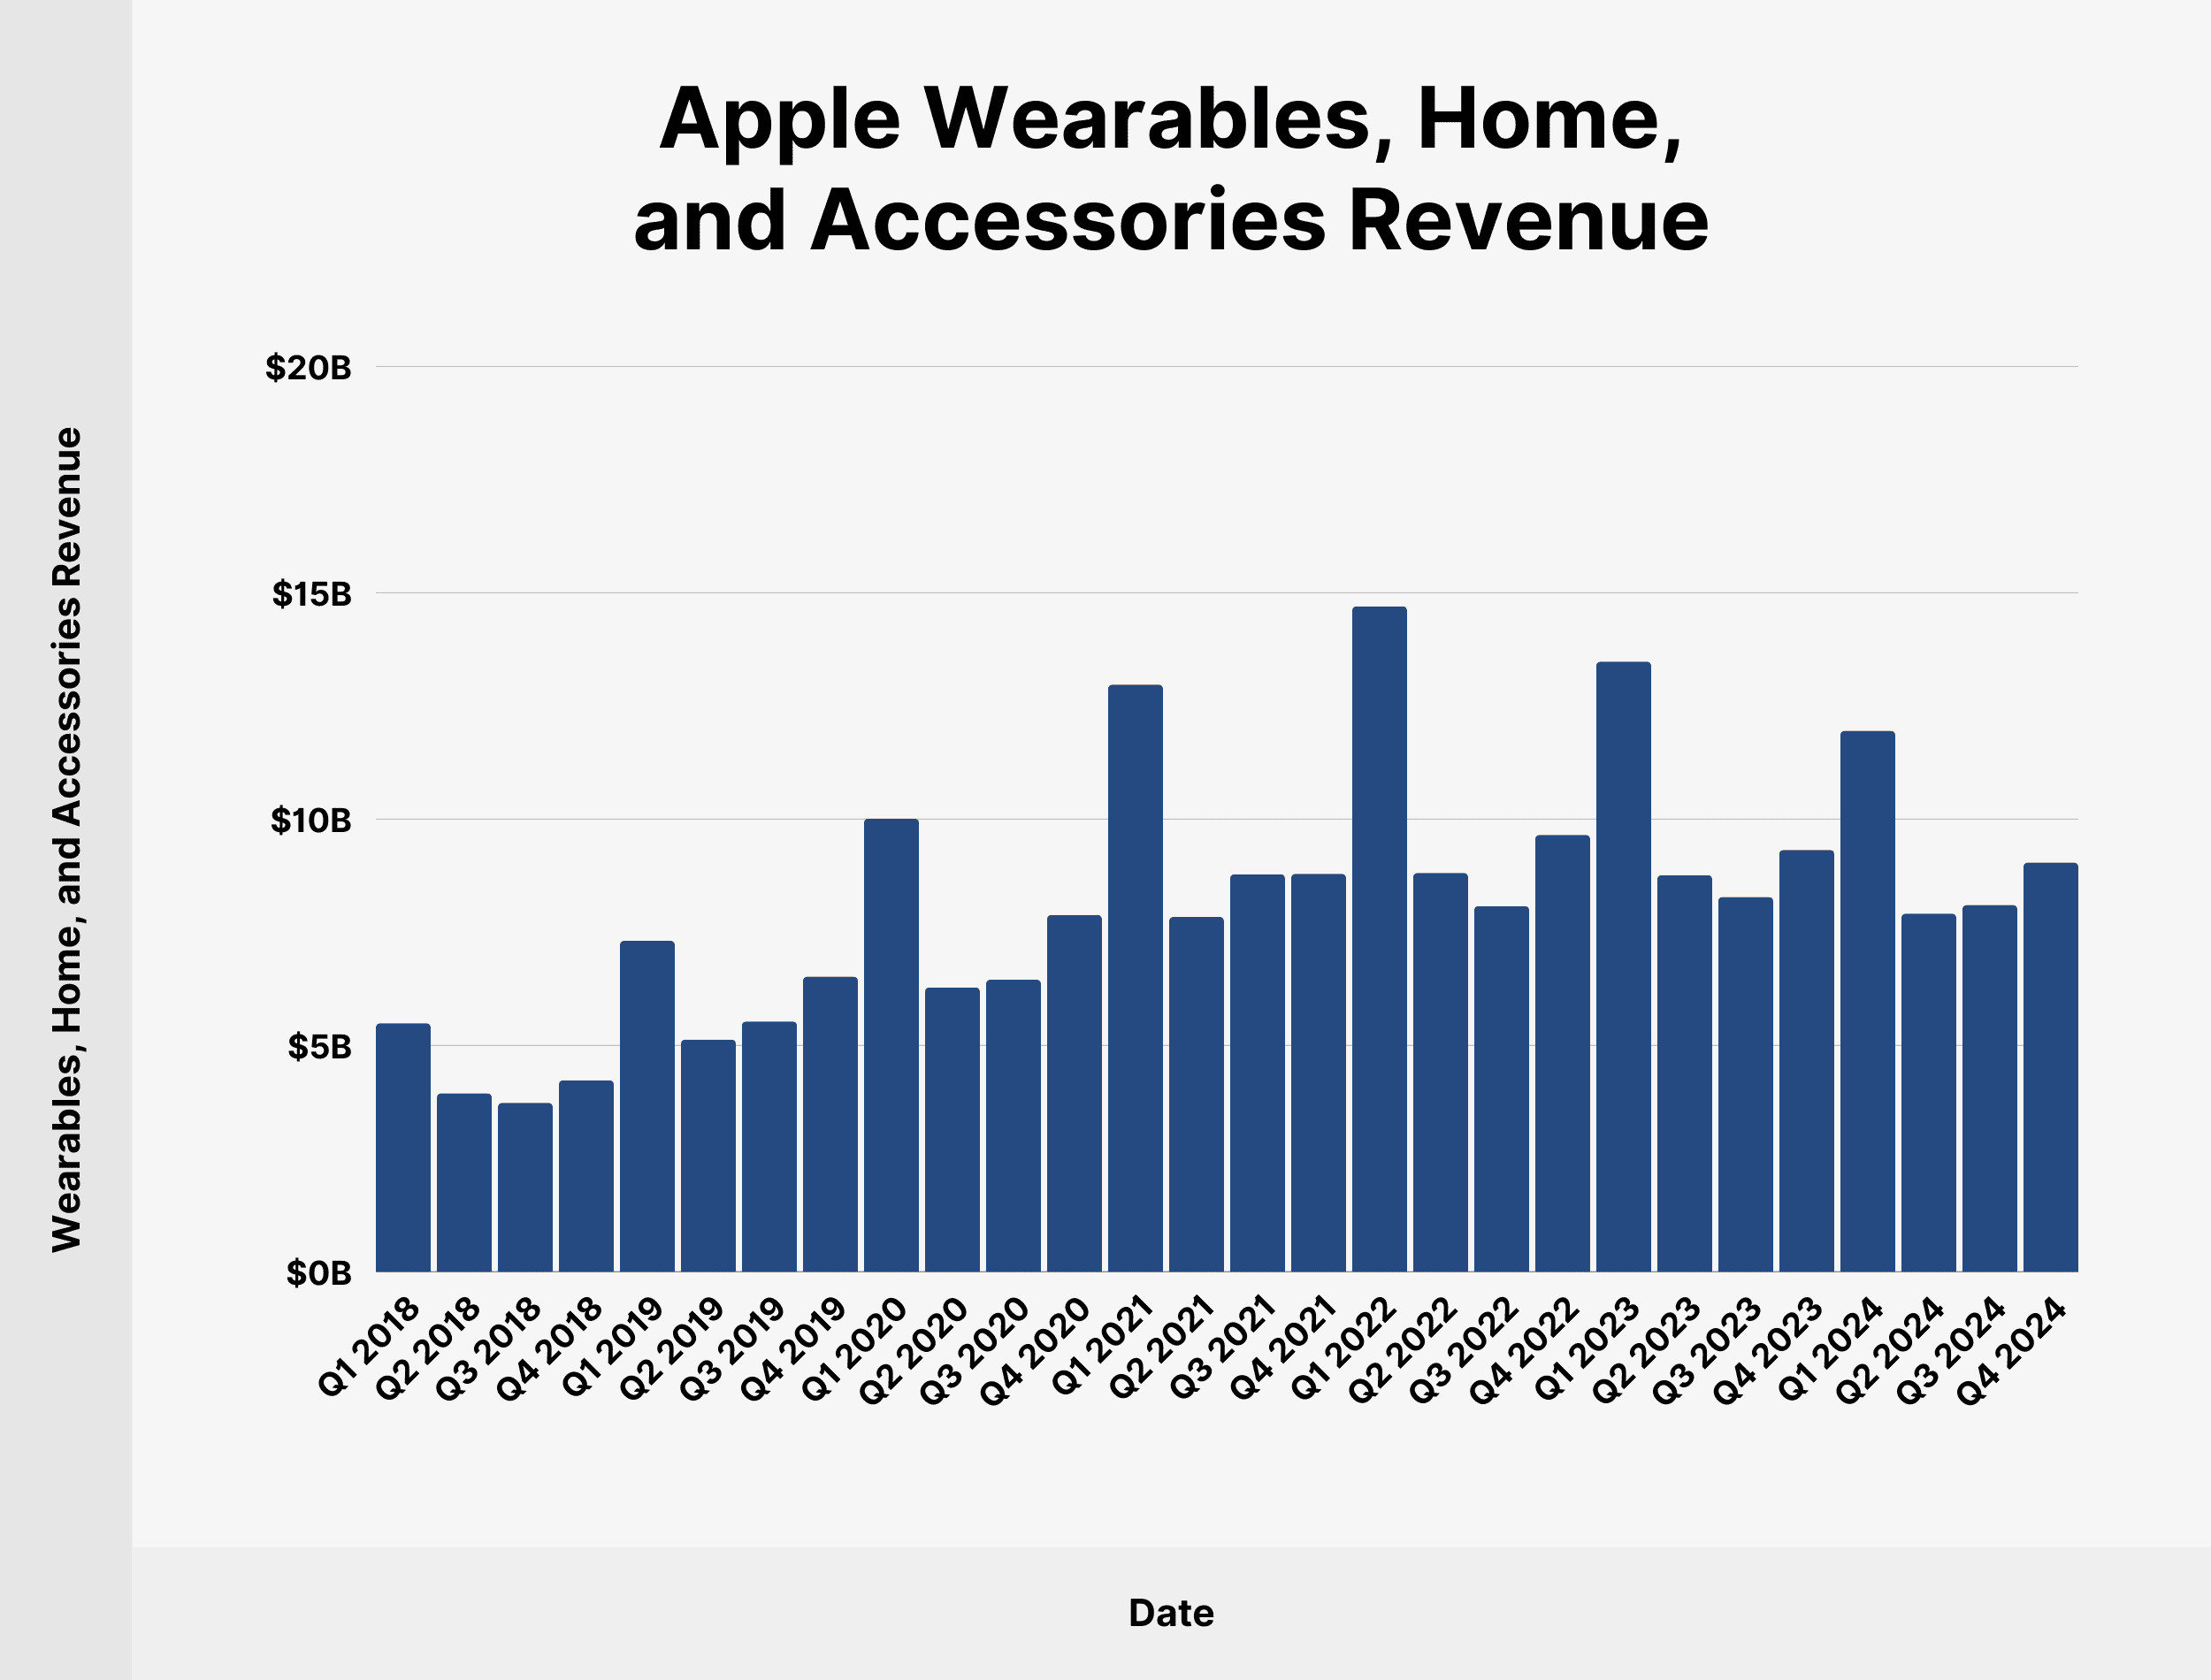
5. What Is the Revenue From Apple Wearables, Home, and Accessories?
Apple wearables, home, and accessories include sales of the Apple Watch, wireless headphones, HomePod, Apple TV, and accessories. In Q4 2024, this category generated $9.04 billion, accounting for 9.52% of total revenue, surpassing both Mac ($7.74 billion) and iPad ($6.96 billion) sales.
Below is a detailed breakdown of Apple wearables, home, and accessories revenue since Q1 2018:
| Date | Wearables, Home, and Accessories Revenue | Share of Total Apple Revenue |
|---|---|---|
| Q1 2018 | $5.49 billion | 6.22% |
| Q2 2018 | $3.94 billion | 6.47% |
| Q3 2018 | $3.73 billion | 7.02% |
| Q4 2018 | $4.23 billion | 6.7% |
| Q1 2019 | $7.31 billion | 8.67% |
| Q2 2019 | $5.13 billion | 8.84% |
| Q3 2019 | $5.53 billion | 10.27% |
| Q4 2019 | $6.52 billion | 10.18% |
| Q1 2020 | $10.01 billion | 10.9% |
| Q2 2020 | $6.28 billion | 10.78% |
| Q3 2020 | $6.45 billion | 10.81% |
| Q4 2020 | $7.88 billion | 12.2% |
| Q1 2021 | $12.97 billion | 11.64% |
| Q2 2021 | $7.84 billion | 8.75% |
| Q3 2021 | $8.78 billion | 10.78% |
| Q4 2021 | $8.79 billion | 10.54% |
| Q1 2022 | $14.7 billion | 11.86% |
| Q2 2022 | $8.81 billion | 9.05% |
| Q3 2022 | $8.08 billion | 9.74% |
| Q4 2022 | $9.65 billion | 10.7% |
| Q1 2023 | $13.48 billion | 11.51% |
| Q2 2023 | $8.76 billion | 9.23% |
| Q3 2023 | $8.28 billion | 10.13% |
| Q4 2023 | $9.32 billion | 10.42% |
| Q1 2024 | $11.95 billion | 10% |
| Q2 2024 | $7.91 billion | 8.72% |
| Q3 2024 | $8.1 billion | 9.44% |
| Q4 2024 | $9.04 billion | 9.52% |
 Apple Wearables, Home, and Accessories Revenue
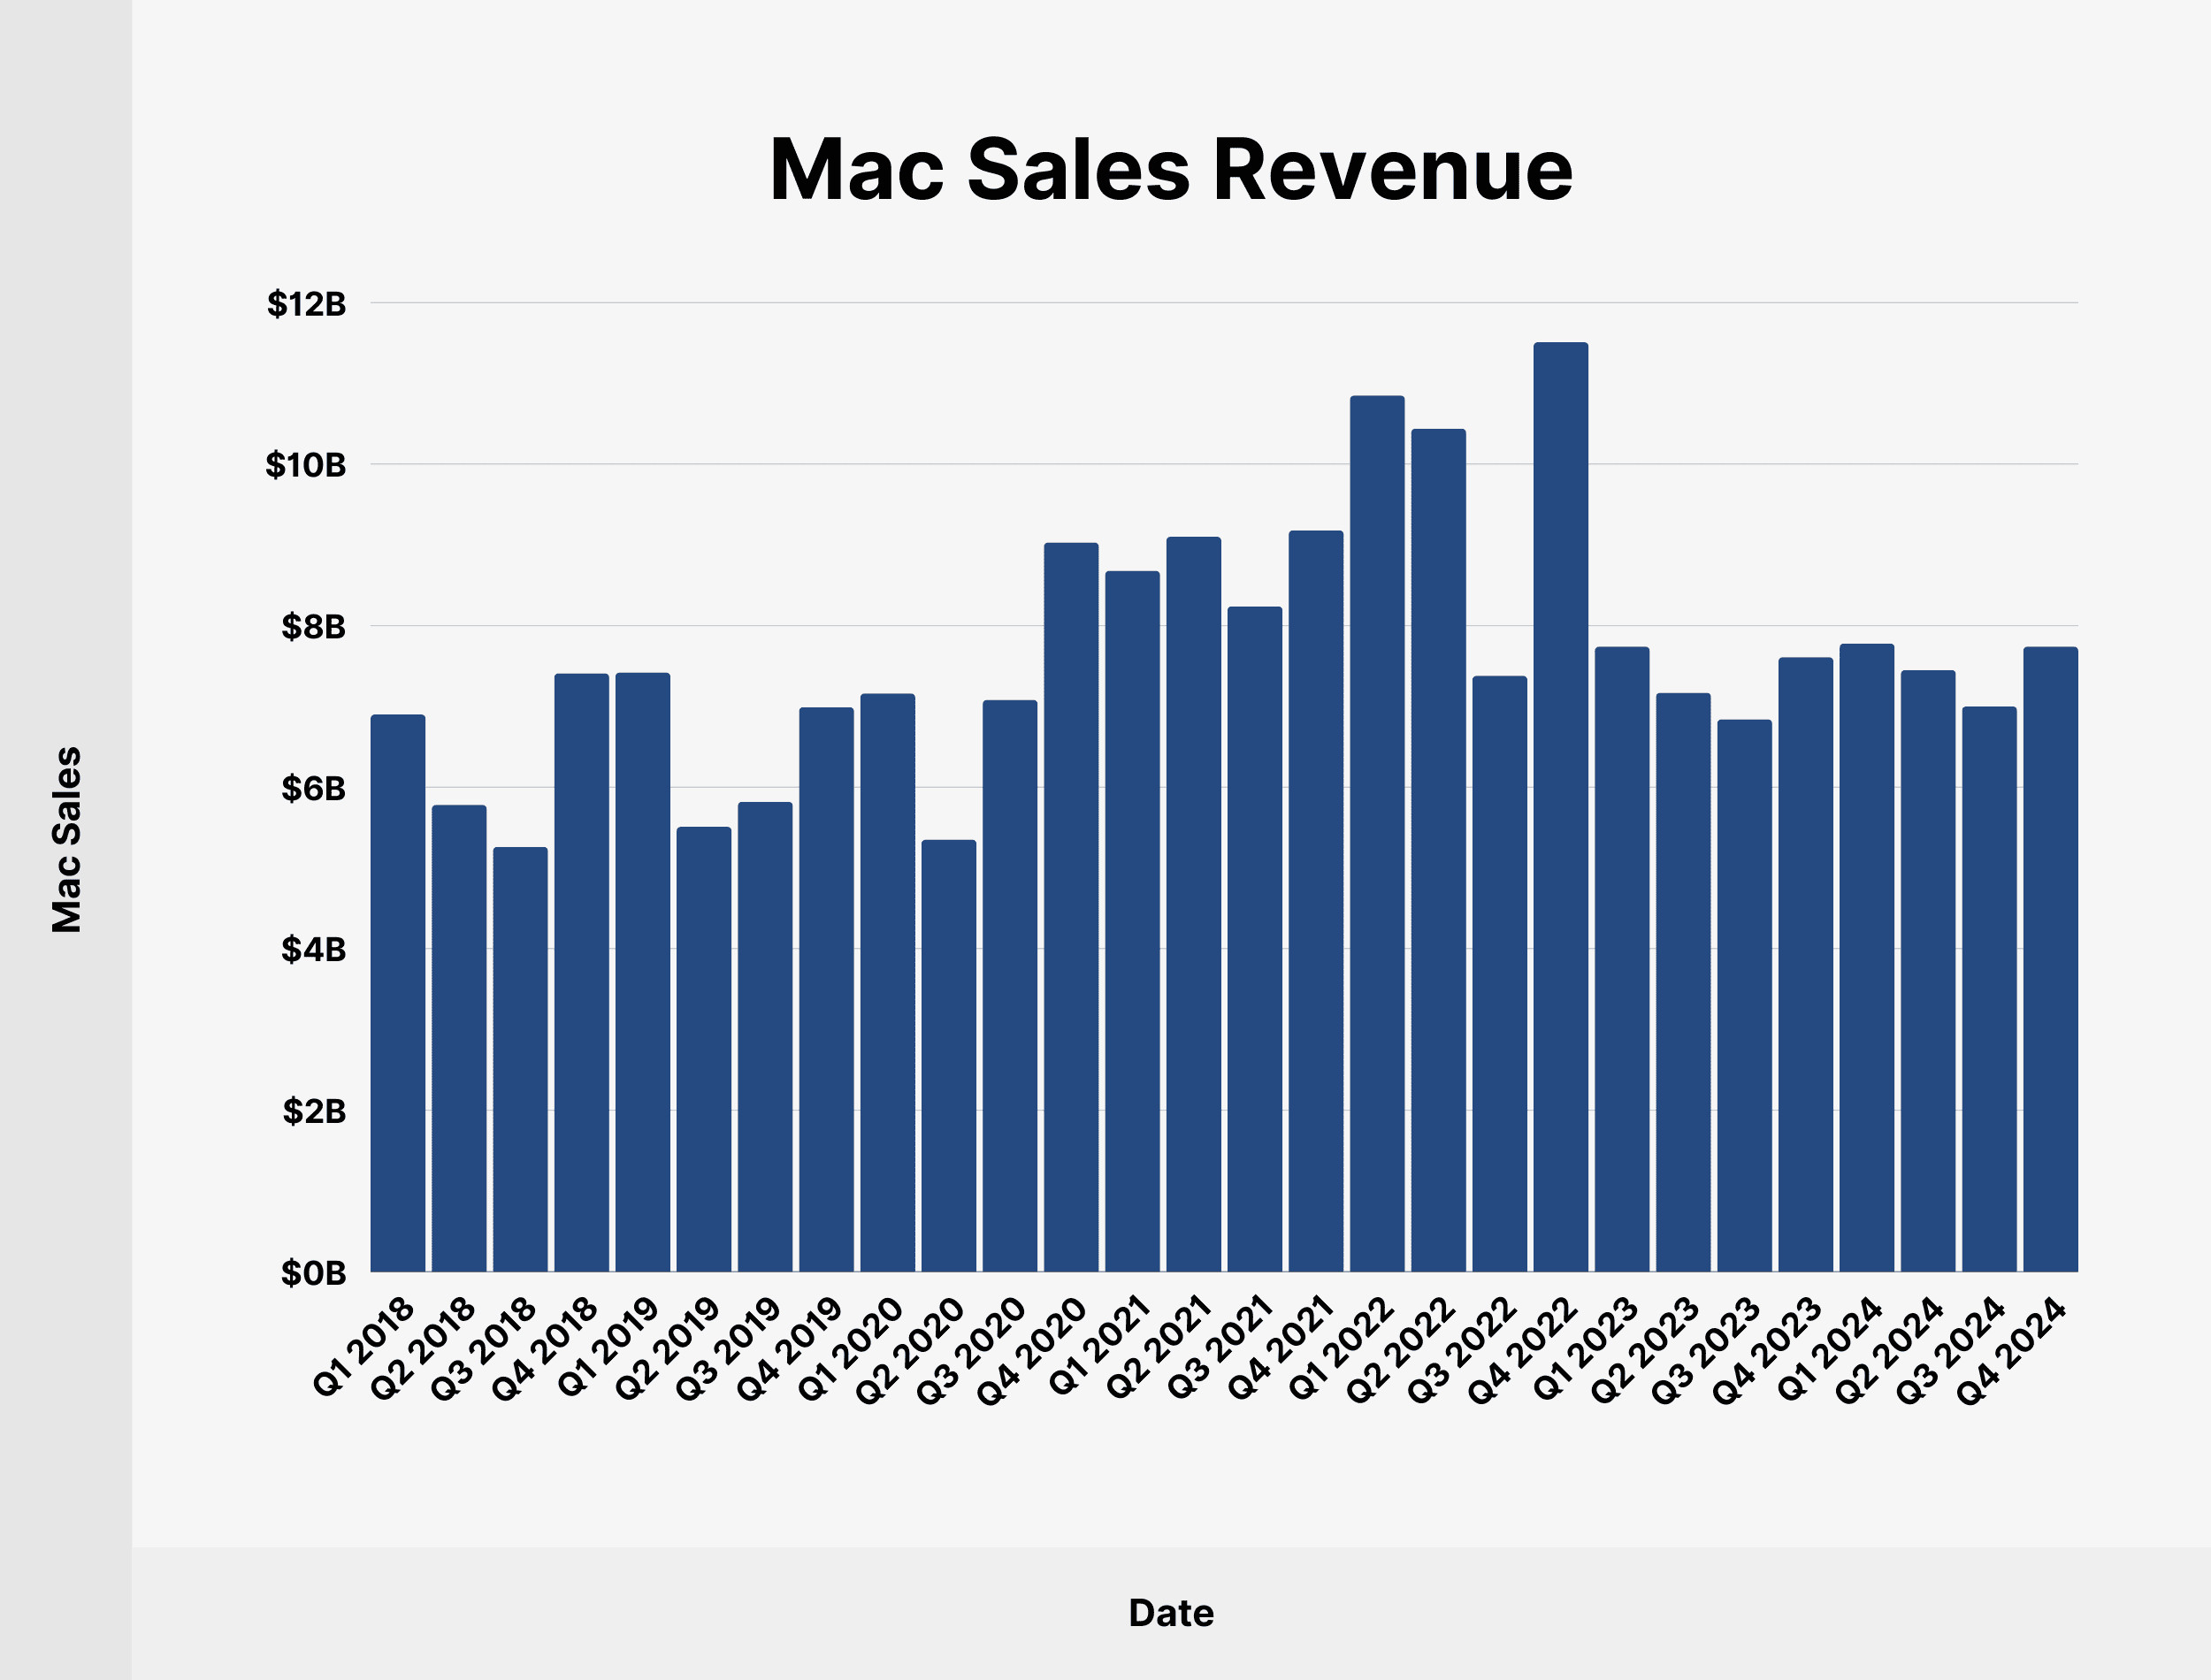
6. What Is the Revenue From Mac Sales?
Mac sales contributed $7.74 billion to Apple’s revenue in Q4 2024, accounting for 8.15% of the total quarterly revenue.
The table below provides Mac revenue figures since Q1 2018:
| Date | Mac Sales | Share of Total Apple Revenue |
|---|---|---|
| Q1 2018 | $6.9 billion | 7.81% |
| Q2 2018 | $5.78 billion | 9.57% |
| Q3 2018 | $5.26 billion | 10% |
| Q4 2018 | $7.41 billion | 11.78% |
| Q1 2019 | $7.42 billion | 8.8% |
| Q2 2019 | $5.51 billion | 9.5% |
| Q3 2019 | $5.82 billion | 10.82% |
| Q4 2019 | $6.99 billion | 10.92% |
| Q1 2020 | $7.16 billion | 7.8% |
| Q2 2020 | $5.35 billion | 9.18% |
| Q3 2020 | $7.08 billion | 11.86% |
| Q4 2020 | $9.03 billion | 14% |
| Q1 2021 | $8.68 billion | 7.78% |
| Q2 2021 | $9.1 billion | 10.16% |
| Q3 2021 | $8.24 billion | 10.11% |
| Q4 2021 | $9.18 billion | 11.01% |
| Q1 2022 | $10.85 billion | 8.76% |
| Q2 2022 | $10.44 billion | 10.73% |
| Q3 2022 | $7.38 billion | 8.9% |
| Q4 2022 | $11.51 billion | 12.77% |
| Q1 2023 | $7.74 billion | 6.6% |
| Q2 2023 | $7.17 billion | 7.56% |
| Q3 2023 | $6.84 billion | 8.36% |
| Q4 2023 | $7.61 billion | 8.5% |
| Q1 2024 | $7.78 billion | 6.51% |
| Q2 2024 | $7.45 billion | 8.21% |
| Q3 2024 | $7 billion | 8.16% |
| Q4 2024 | $7.74 billion | 8.15% |
 Mac Sales Revenue
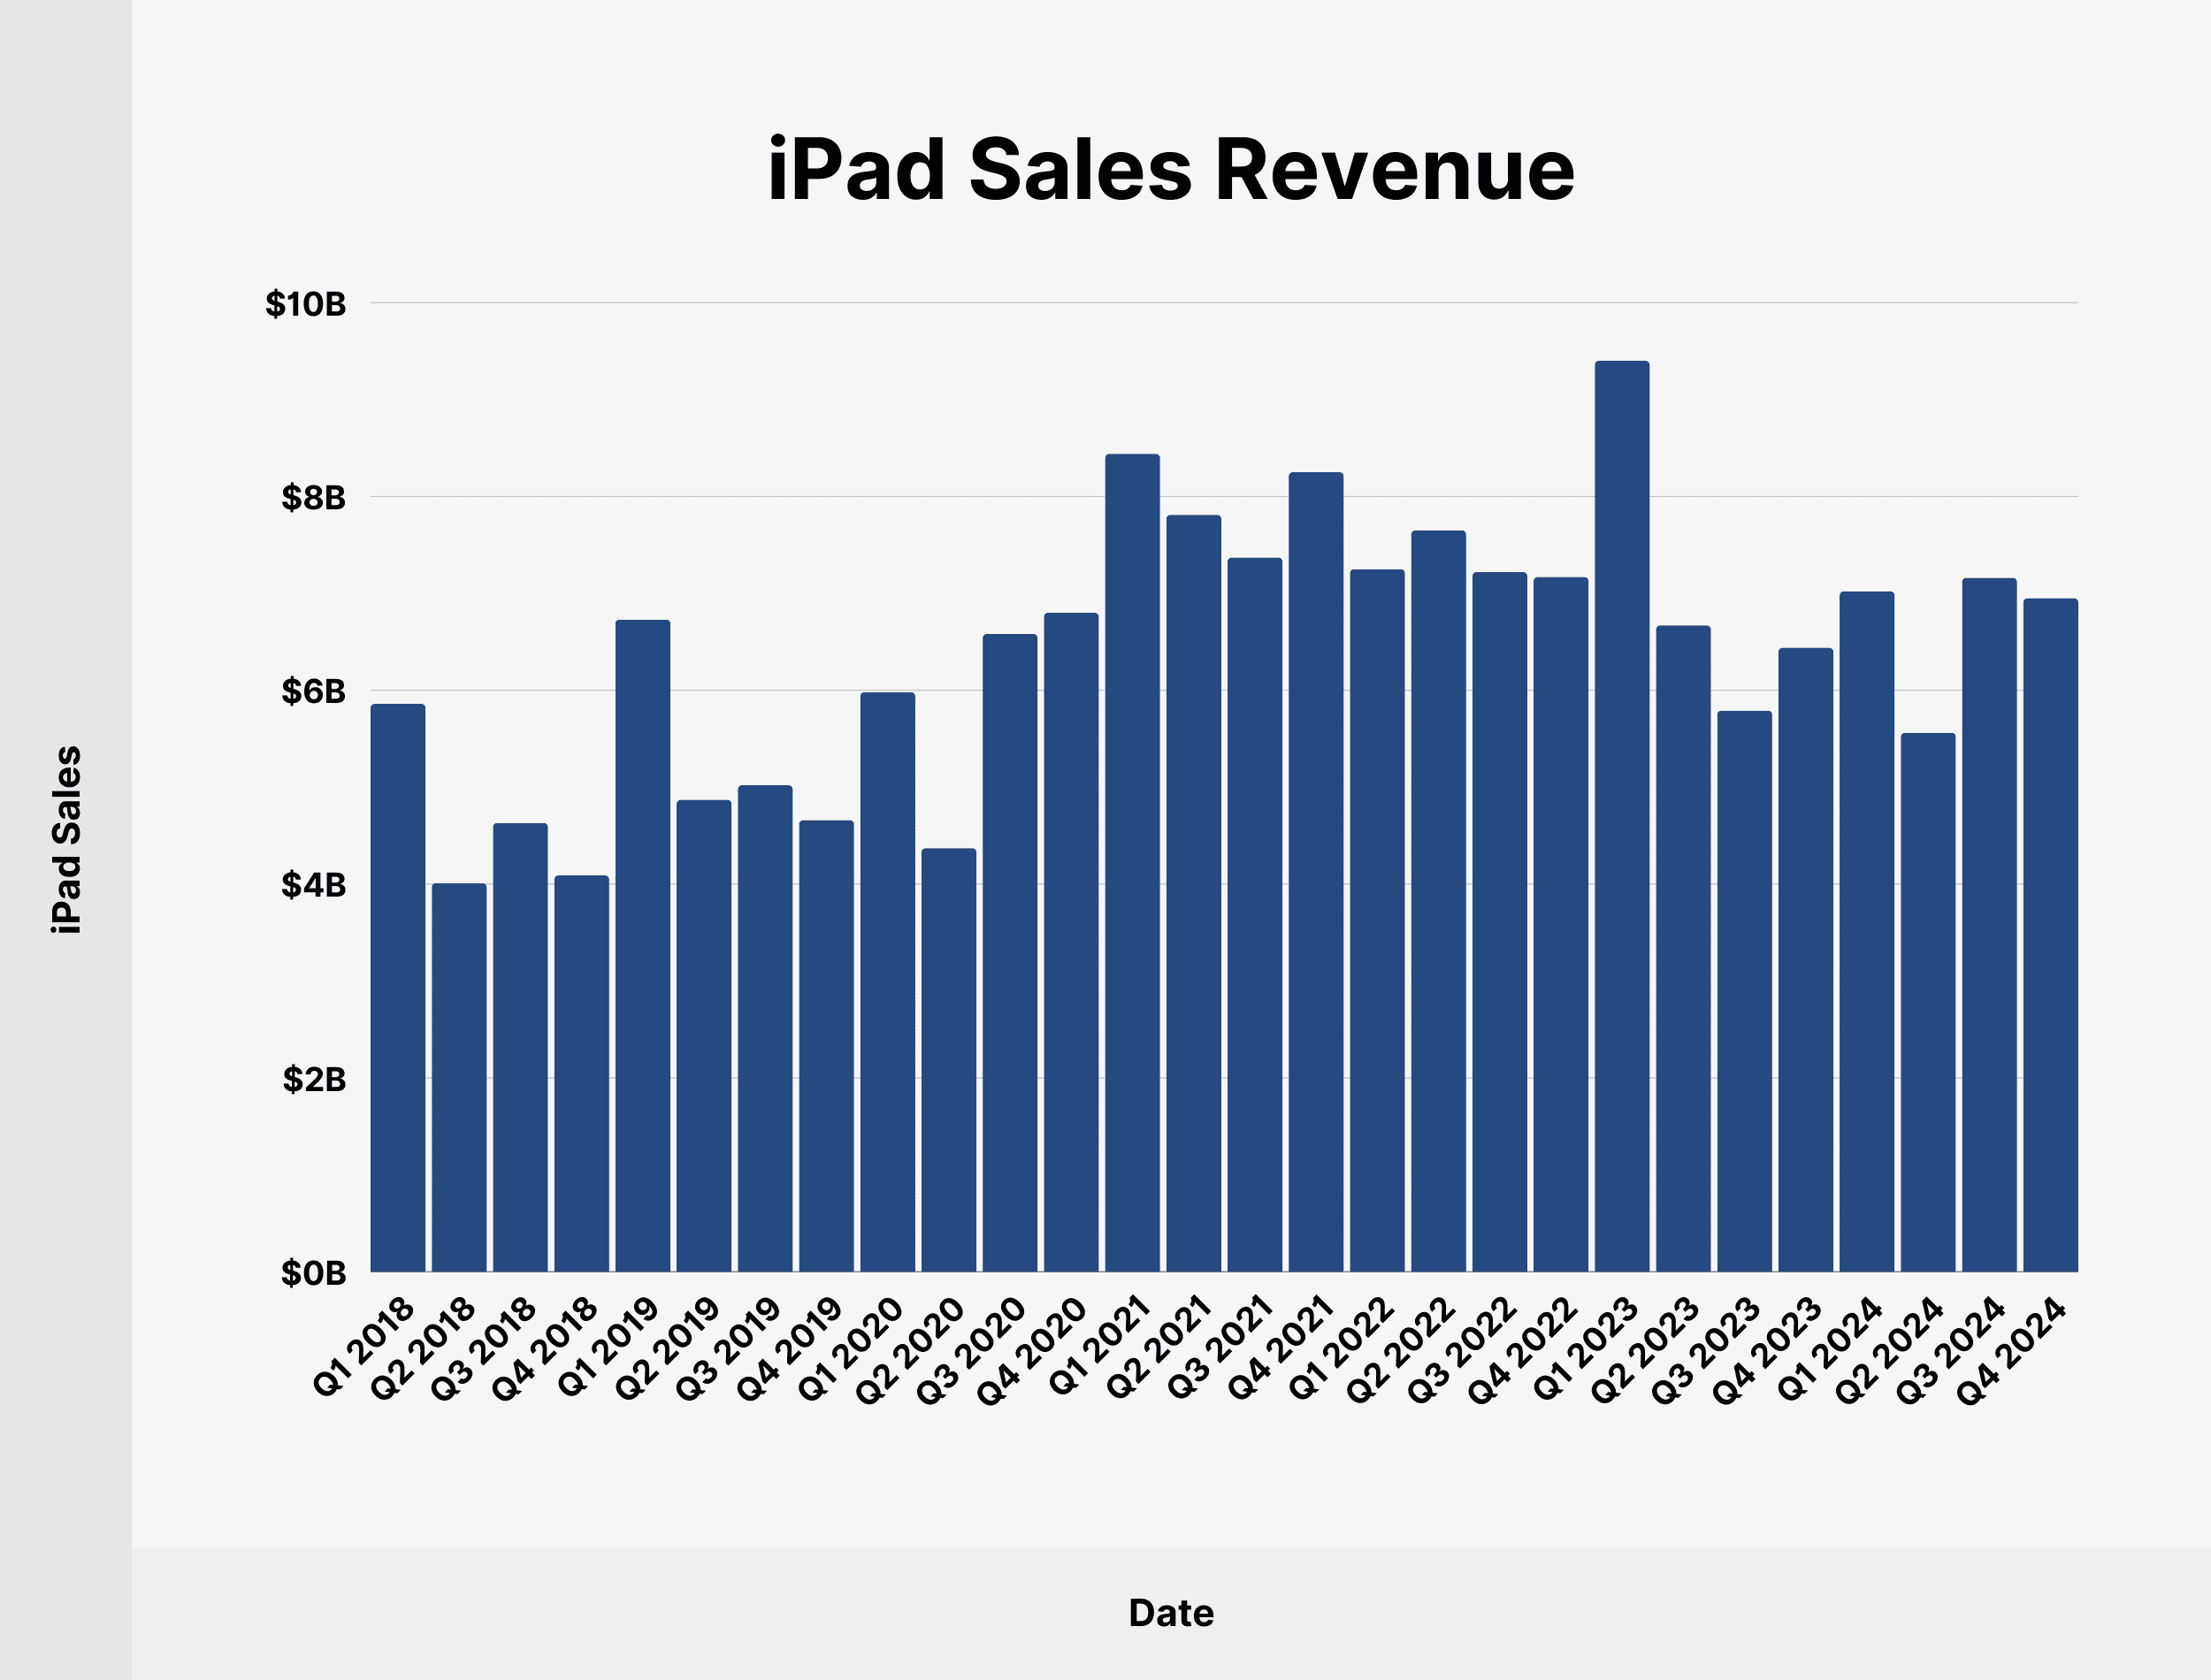
7. How Much Revenue Does Apple Make From iPad Sales?
In Q4 2024, iPad sales reached $6.95 billion, which is 7.32% of Apple’s total quarterly revenue.
The following table shows iPad sales data since Q1 2018:
| Date | iPad Sales | Share of Total Apple Revenue |
|---|---|---|
| Q1 2018 | $5.86 billion | 6.44% |
| Q2 2018 | $4.01 billion | 6.73% |
| Q3 2018 | $4.63 billion | 8.9% |
| Q4 2018 | $4.09 billion | 6.5% |
| Q1 2019 | $6.73 billion | 7.98% |
| Q2 2019 | $4.87 billion | 8.4% |
| Q3 2019 | $5.02 billion | 9.33% |
| Q4 2019 | $4.66 billion | 7.27% |
| Q1 2020 | $5.98 billion | 6.51% |
| Q2 2020 | $4.37 billion | 7.5% |
| Q3 2020 | $6.58 billion | 11.03% |
| Q4 2020 | $6.8 billion | 10.05% |
| Q1 2021 | $8.44 billion | 7.57% |
| Q2 2021 | $7.81 billion | 8.71% |
| Q3 2021 | $7.37 billion | 9.05% |
| Q4 2021 | $8.25 billion | 9.9% |
| Q1 2022 | $7.25 billion | 5.85% |
| Q2 2022 | $7.65 billion | 7.86% |
| Q3 2022 | $7.22 billion | 8.71% |
| Q4 2022 | $7.17 billion | 7.96% |
| Q1 2023 | $9.4 billion | 8.02% |
| Q2 2023 | $6.67 billion | 7.03% |
| Q3 2023 | $5.79 billion | 7.08% |
| Q4 2023 | $6.44 billion | 7.2% |
| Q1 2024 | $7.02 billion | 5.87% |
| Q2 2024 | $5.56 billion | 6.13% |
| Q3 2024 | $7.16 billion | 8.35% |
| Q4 2024 | $6.95 billion | 7.32% |
 iPad Sales Revenue
8. What Is Apple’s Revenue by Region?
Apple’s financial performance varies significantly across different regions. The Americas region is the largest contributor, followed by Europe and Greater China. Understanding these regional revenue distributions can provide insights into Apple’s global strategy and market penetration.
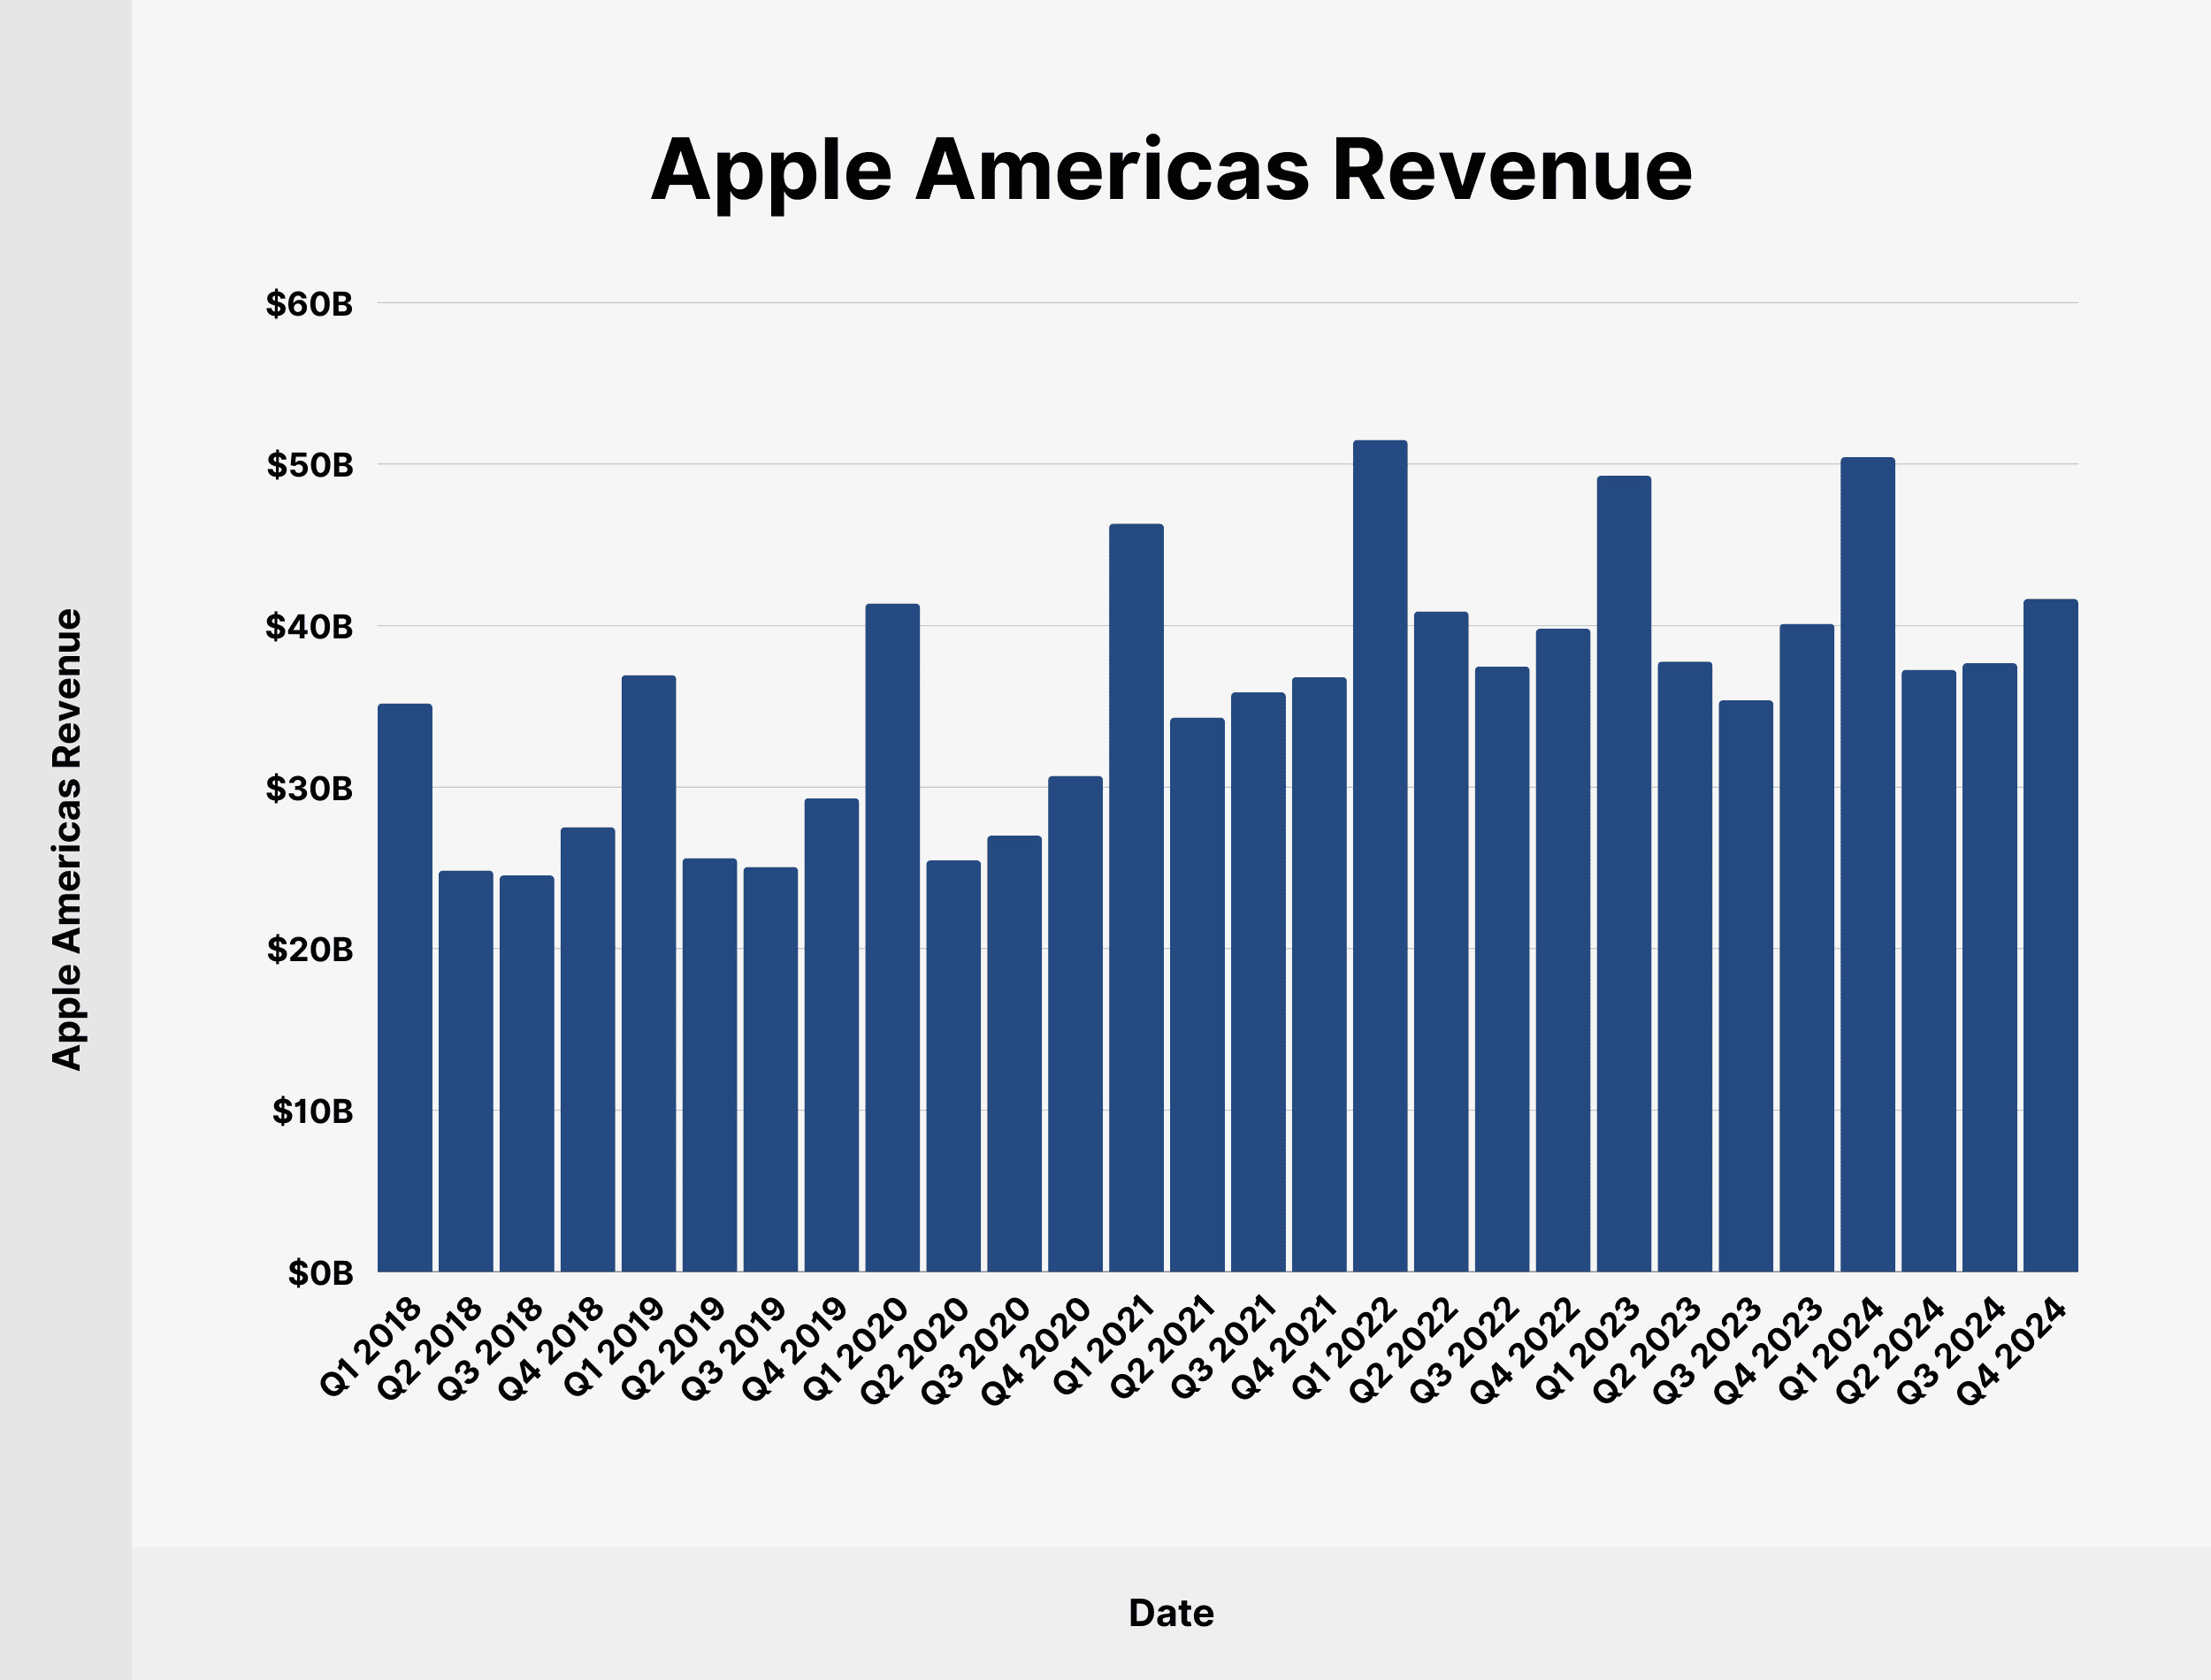
8.1. How Much Revenue Does Apple Generate in the Americas?
The Americas region accounted for $41.66 billion, or 43.89%, of Apple’s total revenue in Q4 2024. This represents a 3.84% increase compared to the previous year.
Here’s a breakdown of Apple’s quarterly revenue in the Americas since Q1 2018:
| Date | Apple Americas Revenue | Share of Total Apple Revenue |
|---|---|---|
| Q1 2018 | $35.19 billion | 39.9% |
| Q2 2018 | $24.84 billion | 40.63% |
| Q3 2018 | $24.54 billion | 46.08% |
| Q4 2018 | $27.52 billion | 43.75% |
| Q1 2019 | $36.94 billion | 43.81% |
| Q2 2019 | $25.6 billion | 44.12% |
| Q3 2019 | $25.06 billion | 46.56% |
| Q4 2019 | $29.32 billion | 45.79% |
| Q1 2020 | $41.37 billion | 45.05% |
| Q2 2020 | $25.47 billion | 43.68% |
| Q3 2020 | $27 billion | 45.27% |
| Q4 2020 | $30.7 billion | 45.4% |
| Q1 2021 | $46.31 billion | 41.56% |
| Q2 2021 | $34.31 billion | 38.29% |
| Q3 2021 | $35.87 billion | 44.04% |
| Q4 2021 | $36.82 billion | 44.17% |
| Q1 2022 | $51.5 billion | 41.55% |
| Q2 2022 | $40.88 billion | 42.03% |
| Q3 2022 | $37.47 billion | 45.17% |
| Q4 2022 | $39.81 billion | 44.16% |
| Q1 2023 | $49.28 billion | 42.06% |
| Q2 2023 | $37.78 billion | 39.84% |
| Q3 2023 | $35.38 billion | 43.26% |
| Q4 2023 | $40.12 billion | 44.82% |
| Q1 2024 | $50.43 billion | 42.17% |
| Q2 2024 | $37.27 billion | 41.07% |
| Q3 2024 | $37.68 billion | 43.93% |
| Q4 2024 | $41.66 billion | 43.89% |
 Apple Americas Revenue
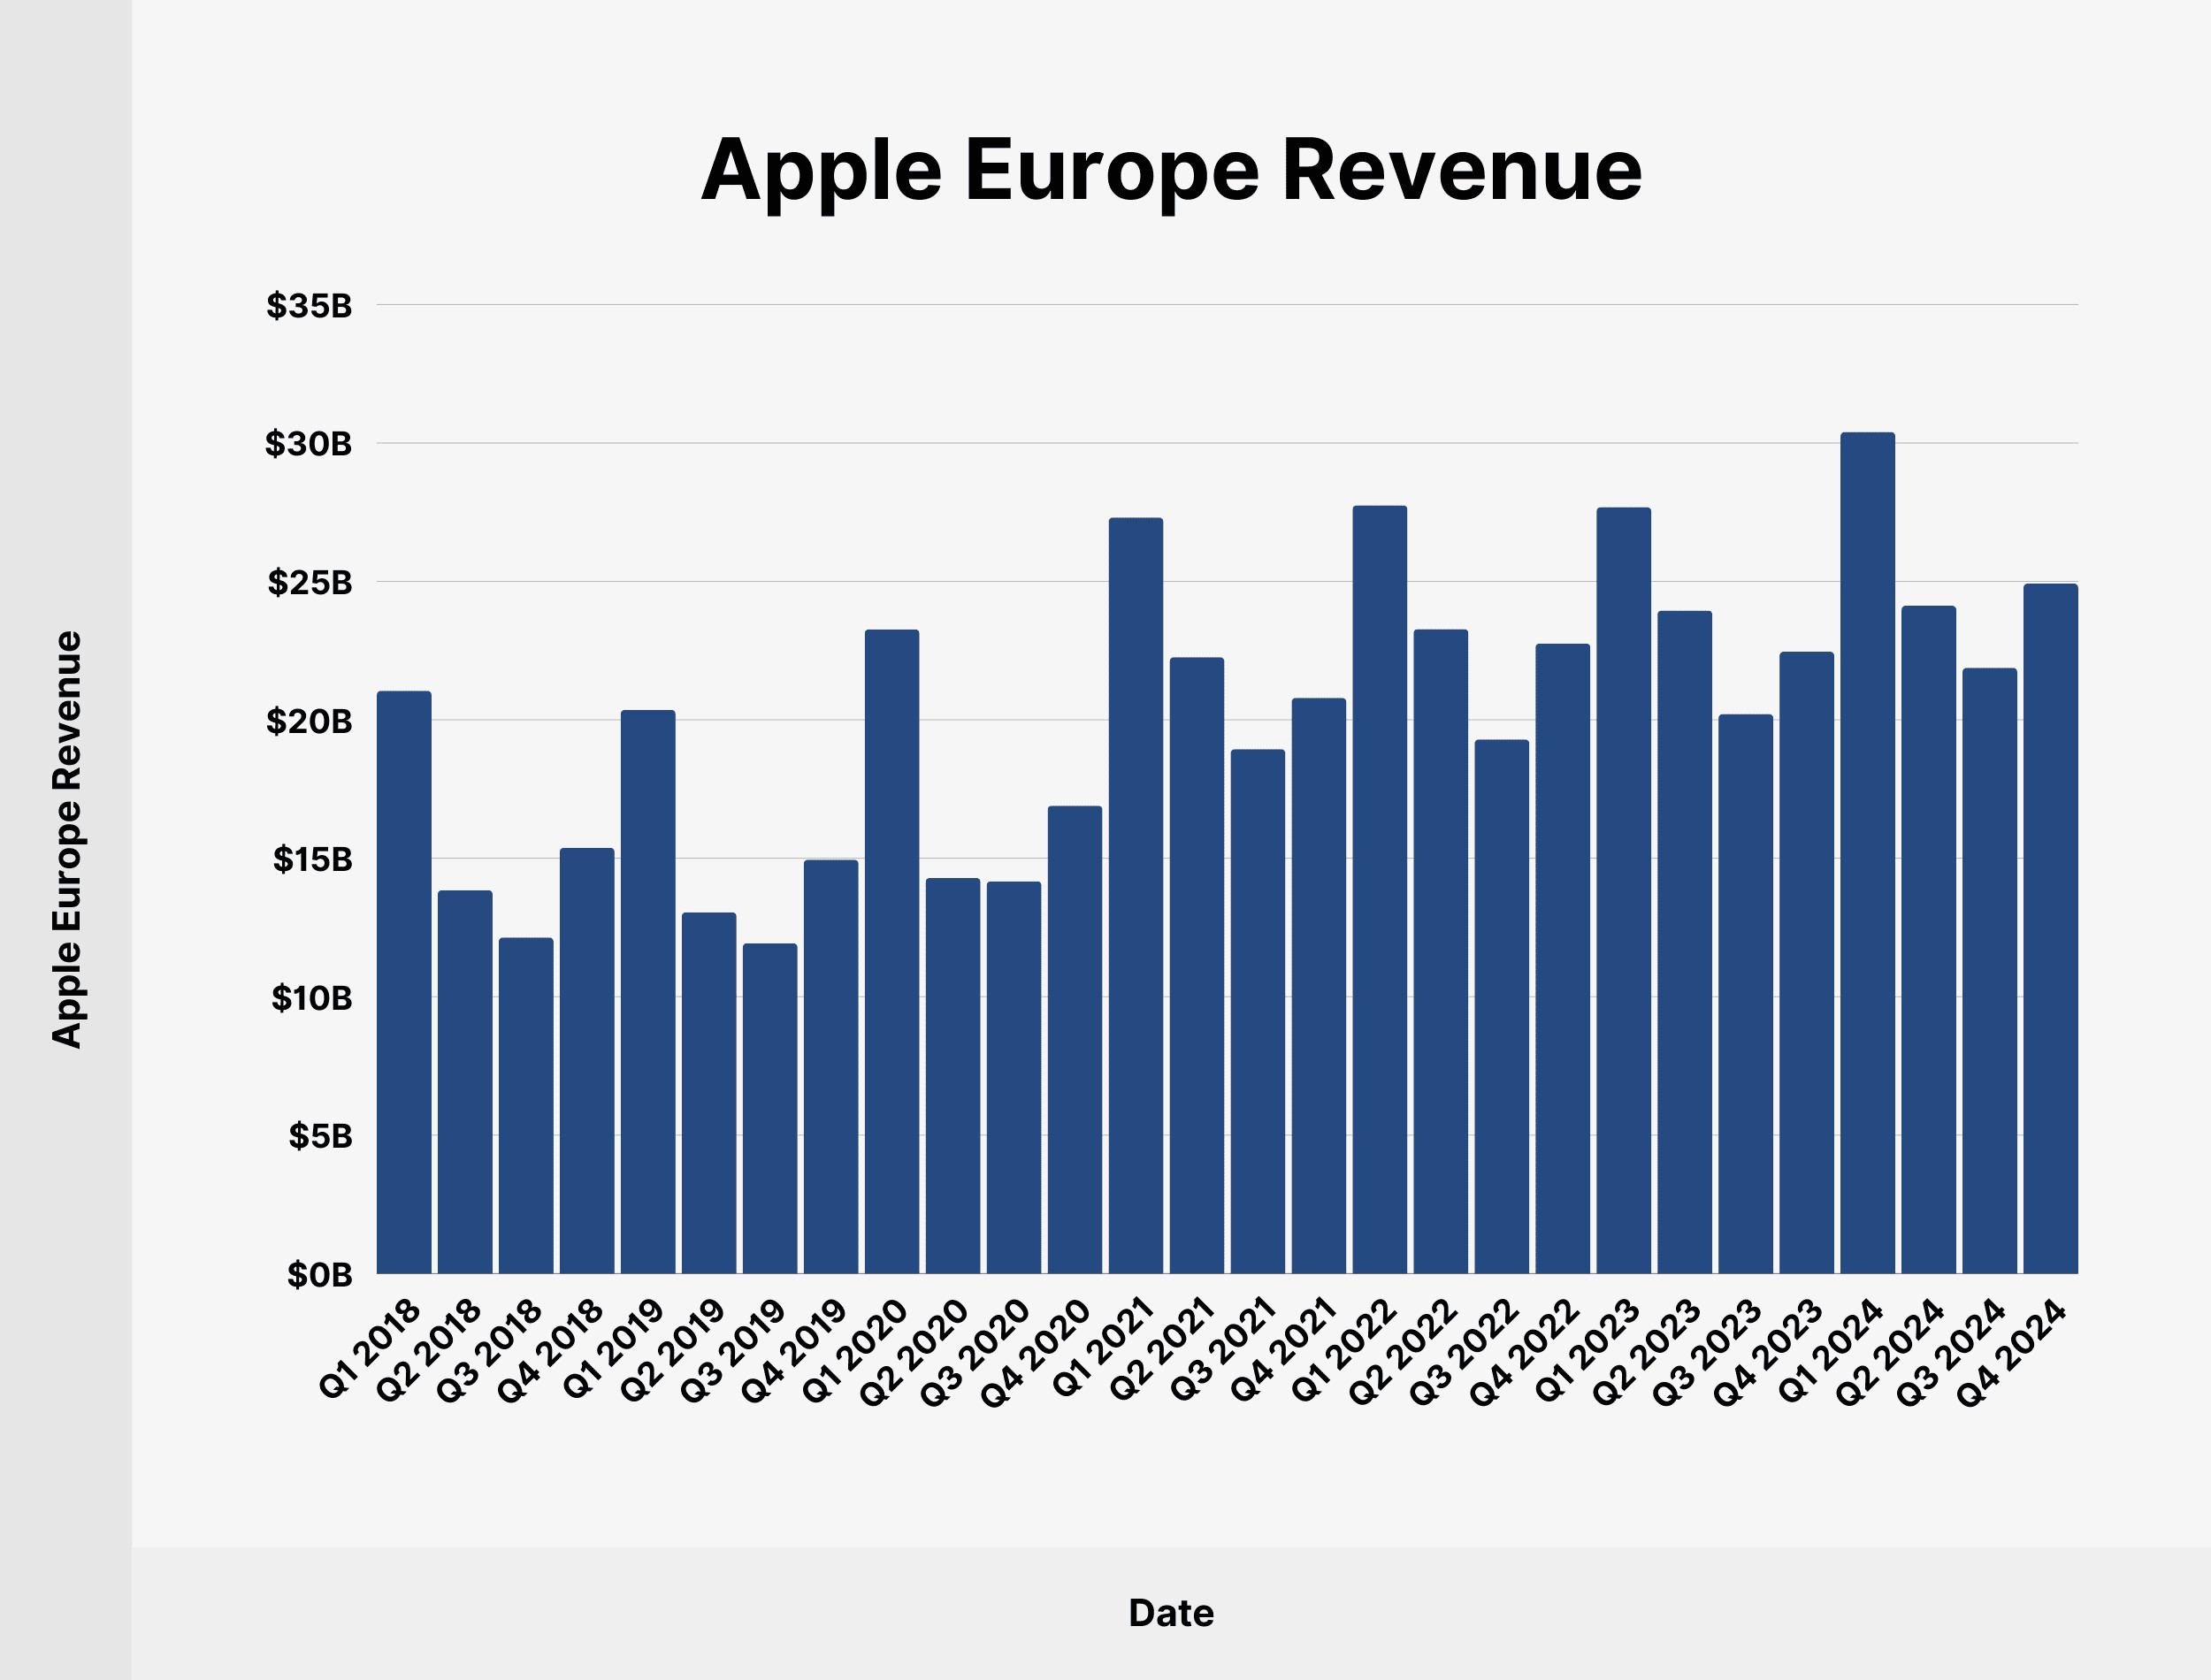
8.2. How Much Revenue Does Apple Generate in Europe?
Europe is Apple’s second-largest market. In Q4 2024, revenue from Europe reached $24.92 billion, representing 26.25% of Apple’s total quarterly revenue.
The following table charts Apple’s quarterly revenue from the European market since Q1 2018:
| Date | Apple Europe Revenue | Share of Total Apple Revenue |
|---|---|---|
| Q1 2018 | $21.05 billion | 23.85% |
| Q2 2018 | $13.85 billion | 22.65% |
| Q3 2018 | $12.14 billion | 22.79% |
| Q4 2018 | $15.38 billion | 24.45% |
| Q1 2019 | $20.36 billion | 24.15% |
| Q2 2019 | $13.05 billion | 22.5% |
| Q3 2019 | $11.93 billion | 22.16% |
| Q4 2019 | $14.95 billion | 23.34% |
| Q1 2020 | $23.27 billion | 25.35% |
| Q2 2020 | $14.29 billion | 24.51% |
| Q3 2020 | $14.17 billion | 23.75% |
| Q4 2020 | $16.9 billion | 25% |
| Q1 2021 | $27.31 billion | 24.5% |
| Q2 2021 | $22.26 billion | 24.85% |
| Q3 2021 | $18.94 billion | 23.26% |
| Q4 2021 | $20.79 billion | 24.94% |
| Q1 2022 | $27.75 billion | 24% |
| Q2 2022 | $23.28 billion | 23.94% |
| Q3 2022 | $19.29 billion | 23.25% |
| Q4 2022 | $22.76 billion | 25.29% |
| Q1 2023 | $27.68 billion | 23.63% |
| Q2 2023 | $23.95 billion | 25.25% |
| Q3 2023 | $20.21 billion | 24.7% |
| Q4 2023 | $22.46 billion | 25.1% |
| Q1 2024 | $30.4 billion | 25.42% |
| Q2 2024 | $24.12 billion | 26.58% |
| Q3 2024 | $21.88 billion | 25.51% |
| Q4 2024 | $24.92 billion | 26.25% |
 Apple Europe Revenue
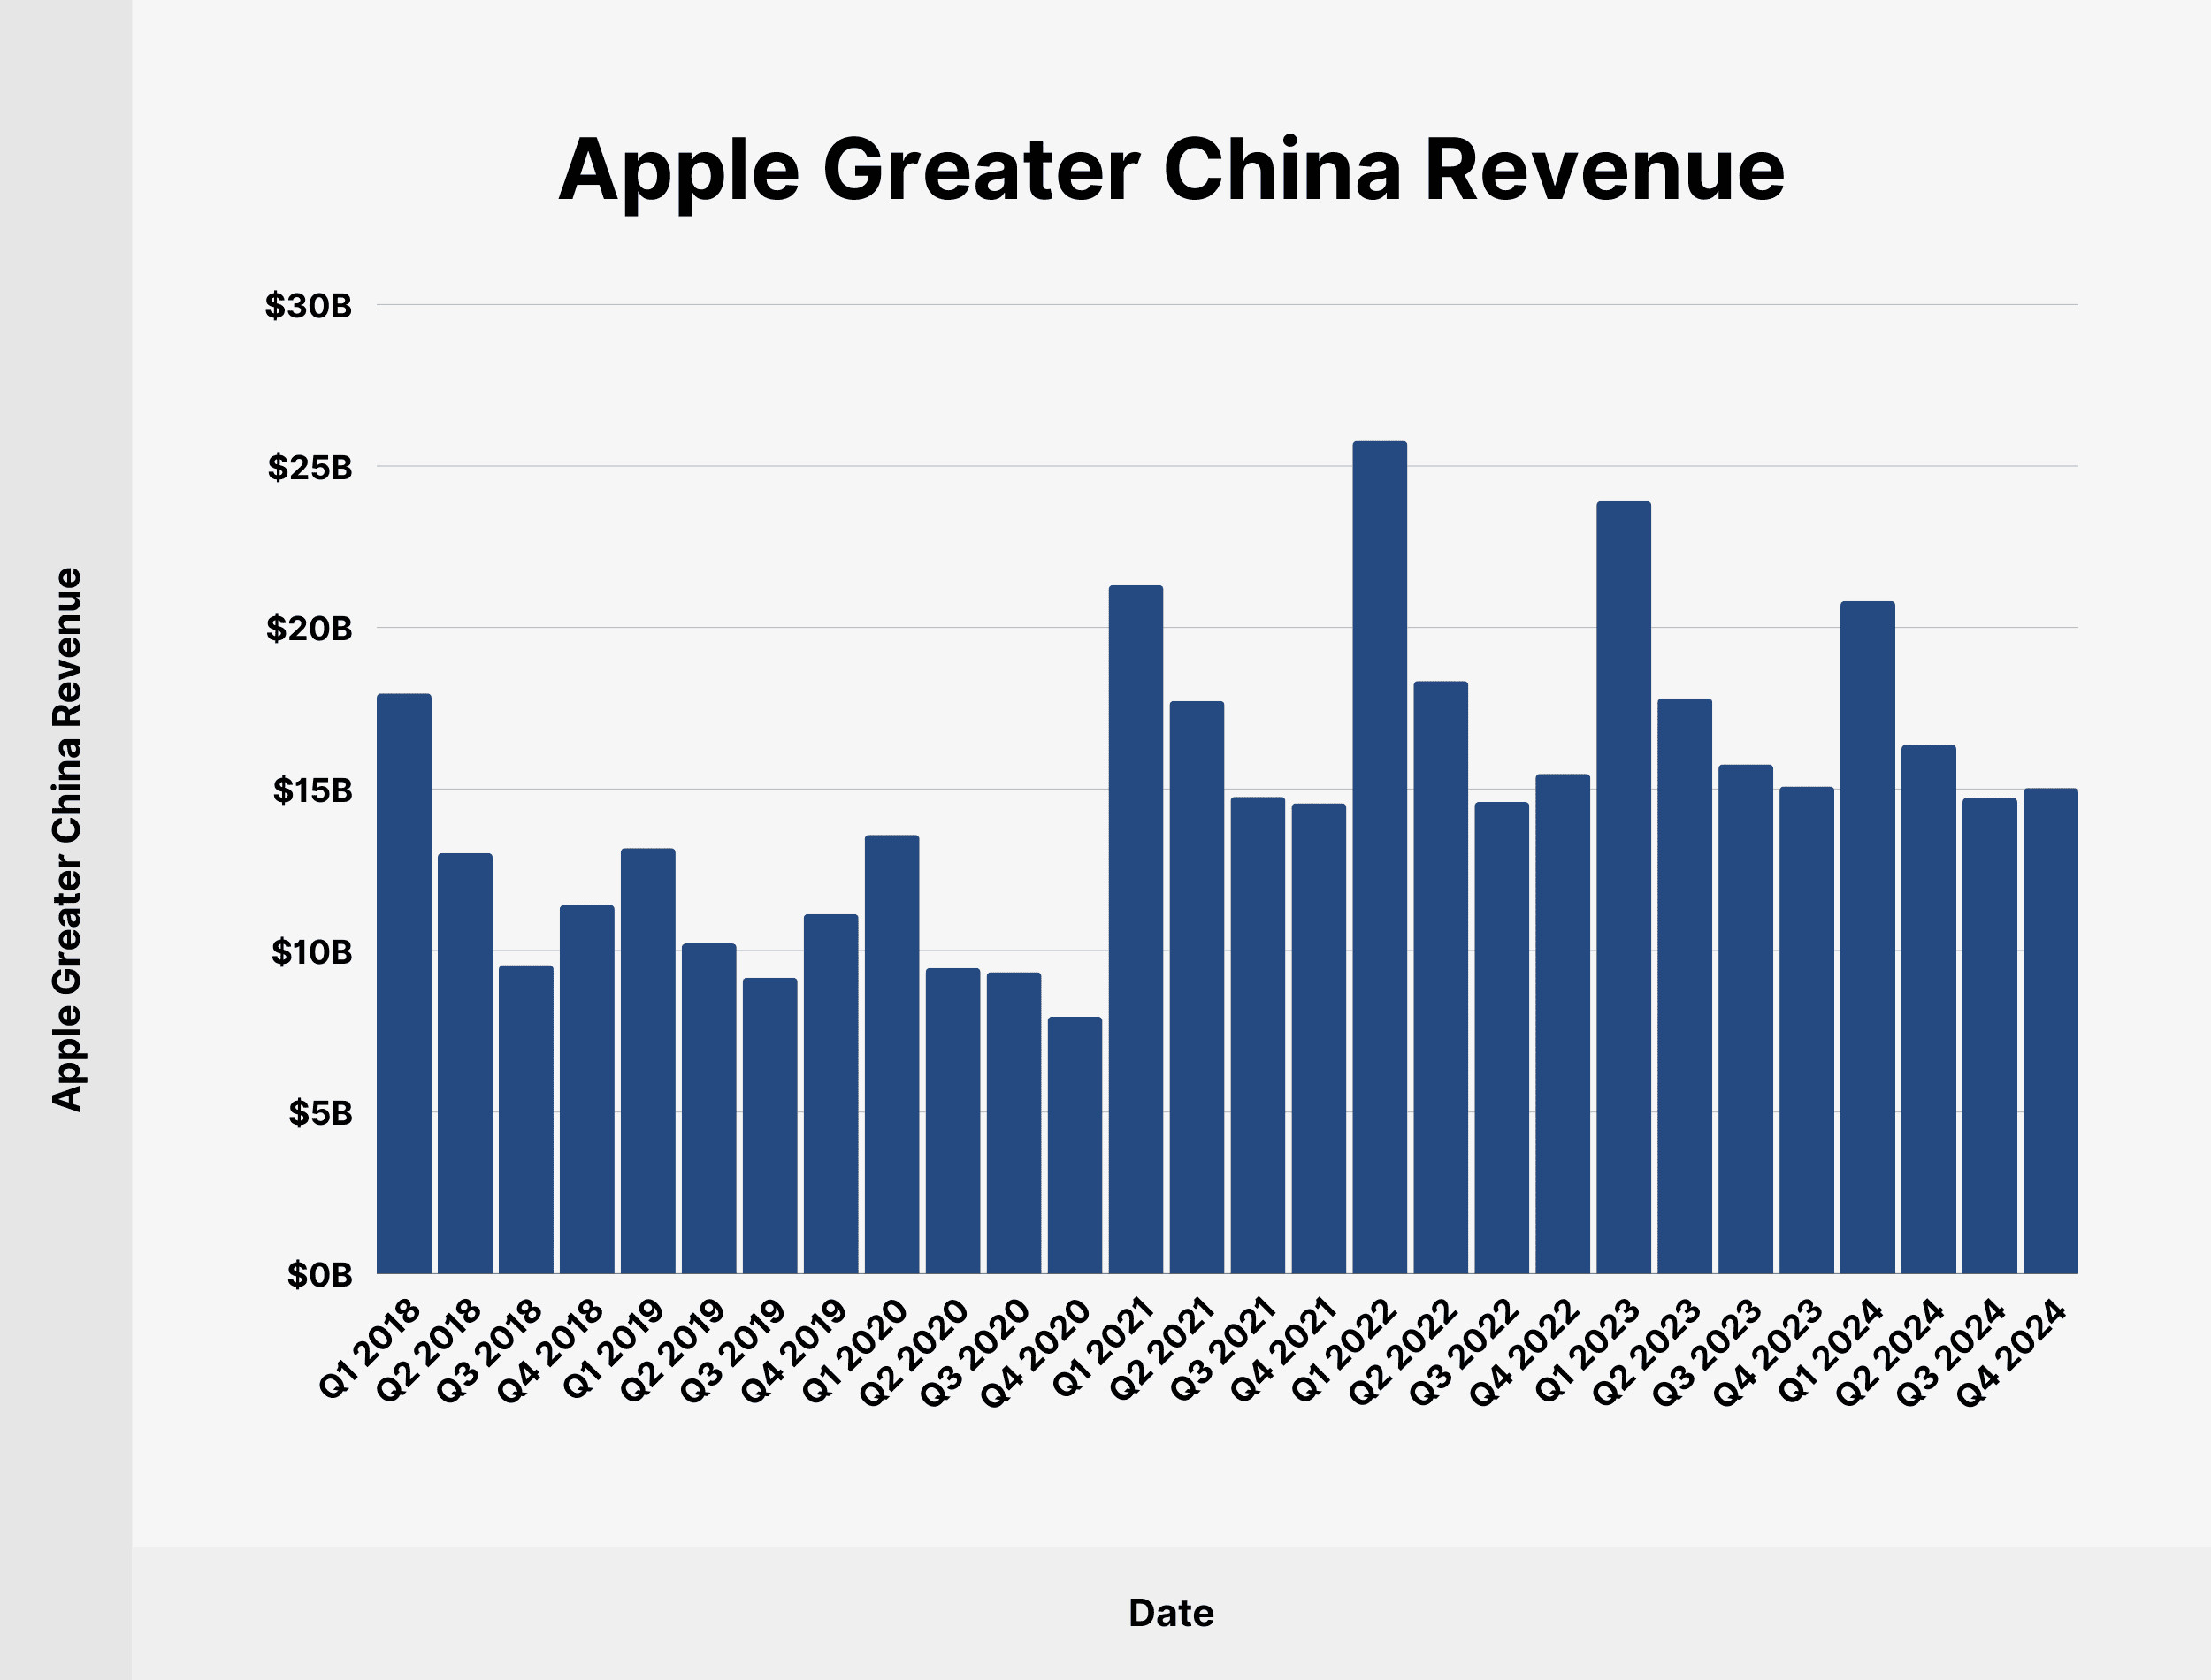
8.3. How Much Revenue Does Apple Generate in Greater China?
The Greater China market contributed $15.03 billion to Apple’s quarterly revenue in Q4 2024, representing 15.83% of the total.
The table below shows Apple’s Greater China revenue since Q1 2018:
| Date | Apple Greater China Revenue | Share of Total Apple Revenue |
|---|---|---|
| Q1 2018 | $17.96 billion | 20.34% |
| Q2 2018 | $13.02 billion | 21.3% |
| Q3 2018 | $9.55 billion | 17.93% |
| Q4 2018 | $11.41 billion | 18.14% |
| Q1 2019 | $13.17 billion | 15.62% |
| Q2 2019 | $10.22 billion | 17.61% |
| Q3 2019 | $9.16 billion | 17.02% |
| Q4 2019 | $11.13 billion | 17.39% |
| Q1 2020 | $13.58 billion | 14.79% |
| Q2 2020 | $9.46 billion | 16.21% |
| Q3 2020 | $9.33 billion | 15.63% |
| Q4 2020 | $7.95 billion | 14.7% |
| Q1 2021 | $21.31 billion | 19.13% |
| Q2 2021 | $17.73 billion | 19.79% |
| Q3 2021 | $14.76 billion | 18.13% |
| Q4 2021 | $14.56 billion | 17.47% |
| Q1 2022 | $25.78 billion | 20.8% |
| Q2 2022 | $18.34 billion | 18.86% |
| Q3 2022 | $14.6 billion | 17.6% |
| Q4 2022 | $15.47 billion | 17.16% |
| Q1 2023 | $23.91 billion | 20.41% |
| Q2 2023 | $17.81 billion | 18.78% |
| Q3 2023 | $15.76 billion | 19.27% |
| Q4 2023 | $15.08 billion | 16.85% |
| Q1 2024 | $20.82 billion | 17.41% |
| Q2 2024 | $16.37 billion | 18.04% |
| Q3 2024 | $14.73 billion | 17.17% |
| Q4 2024 | $15.03 billion | 15.83% |
 Apple Greater China Revenue
8.4. How Much Revenue Does Apple Generate in Japan?
Apple’s revenue in Japan amounted to $5.93 billion in Q4 2024, representing 6.25% of the total quarterly revenue.
The following table shows Apple Japan’s revenue since Q1 2018:
| Date | Apple Japan Revenue | Share of Total Apple Revenue |
|---|---|---|
| Q1 2018 | $7.24 billion | 8.2% |
| Q2 2018 | $5.47 billion | 8.94% |
| Q3 2018 | $3.87 billion | 7.26% |
| Q4 2018 | $5.16 billion | 8.21 |