How Much Money Is Spent On Christmas? Christmas spending in the USA is a significant economic event, with Americans allocating substantial financial resources to gifts, decorations, and festivities. According to money-central.com, understanding these spending habits can provide valuable insights into consumer behavior and economic trends. By exploring these financial aspects, we can better understand holiday expenses, budgeting strategies, and financial planning, ensuring a joyful and financially sound holiday season.
1. Key American Christmas Spending Statistics
What are the most important statistics that describe spending on christmas? Preliminary data from Christmas 2024 shows that retail sales increased by 3.8% year-over-year, indicating a continued rise in holiday spending. This growth, as reported by Mastercard SpendingPulse, excludes automotive sales to provide a clearer picture of holiday-related expenditures. Jewelry, electronics, and apparel saw significant growth, with online sales outpacing in-store purchases, growing by 6.7% compared to 2.9%, according to money-central.com.
To further expand, let’s review key highlights from 2023:
- Americans spend approximately $900 on Christmas each year.
- 71% of US holiday budgets are allocated to gift purchases.
- US holiday sales have seen year-over-year growth for over a decade.
- 96% of Americans buy gifts for their families.
- Deloitte estimates that Americans spend over $500 annually on non-gift items.
- Canadians spend nearly $1,000 more than Americans during the holidays.
- Men spend, on average, 10% more than women on holiday purchases.
- The highest-spending Americans during the winter holidays are aged 45-54.
- The Northeast outspends the South by approximately $100 per person each year.
- Gift cards are the most popular present to receive.
- 48% of Americans begin Christmas shopping before the end of October.
- More than half (63%) of Americans shop online for holiday purchases.
These figures highlight the comprehensive nature of Christmas spending in the United States.
2. Average Christmas Spending Data
What is the average amount spent during christmas? Americans spend an average of $902 each Christmas, according to the latest data from the National Retail Federation (NRF), which is nearly equivalent to the median pre-tax weekly salary of $1,165, indicating that Americans spend about a week’s salary on Christmas gifts annually, according to money-central.com.
 graphic stating average holiday spending
The breakdown of the $902 average expenditure is as follows:
| Purchase Type | Average Projected Spend (2024) | Percentage of Total Spend |
|---|---|---|
| Gifts for Family, Friends, and Coworkers | $641 | 71% |
| Other Seasonal Items | $261 | 29% |
| Total | $902 | – |
This data shows that over two-thirds of the average American’s holiday budget is dedicated to gifts, with the remainder allocated to decorations and non-gift purchases like travel expenses, as reported by money-central.com.
3. US Christmas Gift Spending Over Time
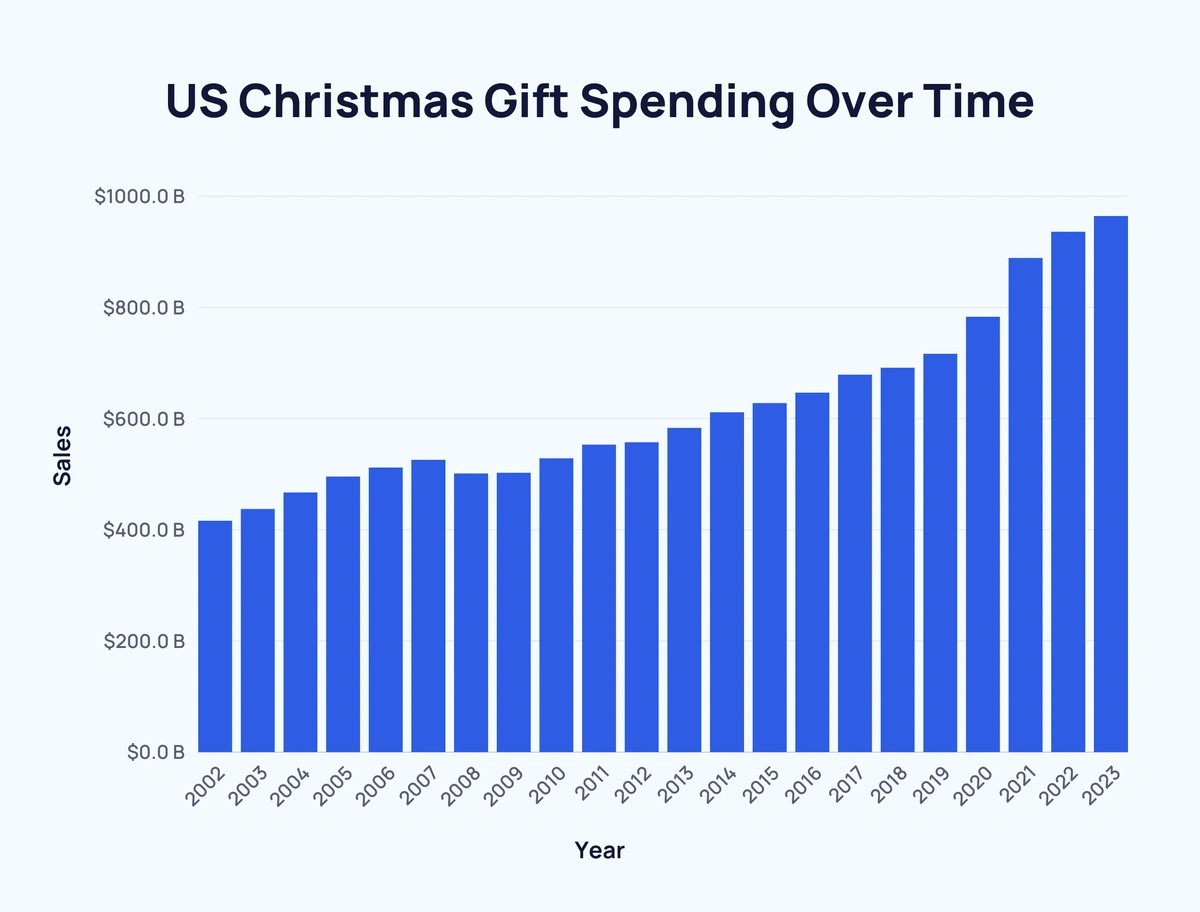
How has US Christmas Gift Spending changed through the years? The National Retail Federation (NRF) reports that US holiday season retail sales have increased year-over-year since 2008, reaching approximately $964.4 billion last year, more than double the $467.2 billion spent in 2004. This demonstrates a consistent upward trend in holiday spending over the past two decades, according to money-central.com.
 bar chart showing Christmas gift spending over time
A detailed look at US holiday sales over time reveals:
| Year | Sales | Sales Change Over Previous Year | Percentage Change Over Previous Year |
|---|---|---|---|
| 2002 | $416.4 billion | – | ↑ 2.1% |
| 2003 | $437.6 billion | ↑ $21.2 billion | ↑ 5.1% |
| 2004 | $467.2 billion | ↑ $29.6 billion | ↑ 6.8% |
| 2005 | $496 billion | ↑ $28.8 billion | ↑ 6.2% |
| 2006 | $512.1 billion | ↑ $16.1 billion | ↑ 3.2% |
| 2007 | $526 billion | ↑ $13.9 billion | ↑ 2.7% |
| 2008 | $501.5 billion | ↓ $24.5 billion | ↓ 4.7% |
| 2009 | $502.7 billion | ↑ $1.2 billion | ↑ 0.2% |
| 2010 | $528.8 billion | ↑ $26.1 billion | ↑ 5.2% |
| 2011 | $553.3 billion | ↑ $24.5 billion | ↑ 4.6% |
| 2012 | $557.6 billion | ↑ $4.3 billion | ↑ 2.6% |
| 2013 | $583.5 billion | ↑ $25.9 billion | ↑ 2.8% |
| 2014 | $611.5 billion | ↑ $28 billion | ↑ 4.8% |
| 2015 | $628.2 billion | ↑ $16.7 billion | ↑ 2.7% |
| 2016 | $646.7 billion | ↑ $18.5 billion | ↑ 3.0% |
| 2017 | $679.2 billion | ↑ $32.5 billion | ↑ 5.0% |
| 2018 | $691.5 billion | ↑ $12.3 billion | ↑ 1.8% |
| 2019 | $716.7 billion | ↑ $25.3 billion | ↑ 3.6% |
| 2020 | $783.4 billion | ↑ $64.4 billion | ↑ 9.3% |
| 2021 | $889.3 billion | ↑ $112 billion | ↑ 13.5% |
| 2022 | $936.3 billion | ↑ $47 billion | ↑ 5.3% |
| 2023 | $964.4 billion | ↑ $28.1 billion | ↑ 3.8% |
Despite the overall increase, gift spending has not risen uniformly across all categories. For instance, spending on gifts for family members has increased from $389 in 2008 to $514 in 2021. However, spending on gifts for friends, coworkers, and other recipients has remained relatively stable, according to money-central.com.
| Year | Gifts for Family | Gifts for Friends | Gifts for Coworkers | Other Gifts |
|---|---|---|---|---|
| Spend | Change | Spend | Change | |
| 2004 | $405 | – | $71 | – |
| 2005 | $419 | ↑ $14 | $79 | ↑ $8 |
| 2006 | $428 | ↑ $9 | $81 | ↑ $2 |
| 2007 | $434 | ↑ $6 | $83 | ↑ $2 |
| 2008 | $389 | ↓ $65 | $79 | ↓ $4 |
| 2009 | $387 | ↓ $2 | $67 | ↓ $12 |
| 2010 | $411 | ↑ $24 | $75 | ↑ $8 |
| 2011 | $424 | ↑ $13 | $72 | ↓ $3 |
| 2012 | $423 | ↓ $1 | $75 | ↑ $3 |
| 2013 | $432 | ↑ $9 | $75 | – $0 |
| 2014 | $459 | ↑ $17 | $80 | ↑ $5 |
| 2015 | $471 | ↑ $12 | $79 | ↓ $1 |
| 2016 | $486 | ↑ $15 | $81 | ↑ $2 |
| 2017 | $478 | ↓ $8 | $75 | ↓ $6 |
| 2018 | $506 | ↑ $28 | $75 | – $0 |
| 2019 | $501 | ↓ $5 | $84 | ↑ $9 |
| 2020 | $502 | ↑ $1 | $80 | ↓ $5 |
| 2021 | $514 | ↑ $12 | $79 | ↓ $1 |
The percentage of Americans purchasing gifts for family has remained relatively constant over the past 15 years. However, the proportion of people buying holiday gifts for friends is down 12% since 2004 and is 15% lower than the peak of 83% in 2006. Additionally, the percentage of individuals purchasing gifts for coworkers has dropped from 39% (41% high in 2008) to 30% in 2021, and other gift purchases are being made by just 41% of Americans, down from 50% in 2004 and 52% in 2006, according to money-central.com.
| Year | Gifts for Family | Gifts for Friends | Gifts for Coworkers | Other Gifts |
|---|---|---|---|---|
| % | Change | % | Change | |
| 2004 | 98% | – | 80% | – |
| 2005 | 98% | – 0% | 81% | ↑ 1% |
| 2006 | 98% | – 0% | 83% | ↑ 2% |
| 2007 | 98% | – 0% | 80% | ↓ 3% |
| 2008 | 98% | – 0% | 80% | – 0% |
| 2009 | 98% | – 0% | 75% | ↓ 5% |
| 2010 | 97% | ↓ 1% | 74% | ↓ 1% |
| 2011 | 97% | – 0% | 74% | – 0% |
| 2012 | 97% | – 0% | 72% | ↓ 2% |
| 2013 | 96% | ↓ 1% | 71% | ↓ 1% |
| 2014 | 97% | ↑ 1% | 73% | ↑ 2% |
| 2015 | 96% | ↓ 1% | 71% | ↓ 2% |
| 2016 | 97% | ↑ 1% | 71% | – 0% |
| 2017 | 97% | – 0% | 70% | ↓ 1% |
| 2018 | 97% | – 0% | 70% | – 0% |
| 2019 | 96% | ↓ 1% | 70% | – 0% |
| 2020 | 96% | – 0% | 67% | ↓ 3% |
| 2021 | 96% | – 0% | 68% | ↑ 1% |
The financial crisis of 2008 significantly impacted holiday spending, with the total spent on gifts for family dropping by $65. This event appeared to have a ripple effect in 2009, reducing the proportion of Americans buying gifts for friends by 5%, gifts for coworkers by 7%, and other gifts by 8%, according to money-central.com.
4. US Christmas Spending Estimates vs Actual
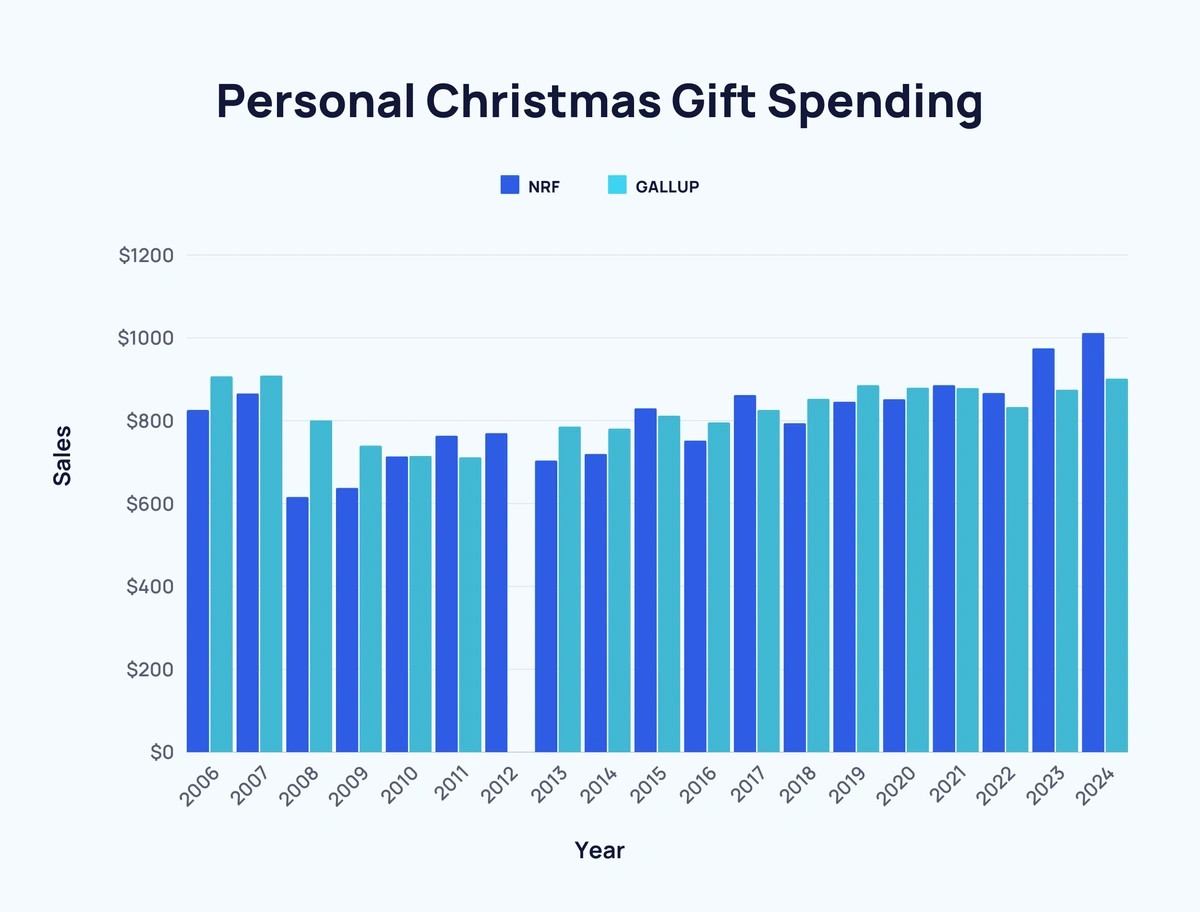
Are spending estimations on par with the actual amount spent? According to recent data, Americans tend to overestimate their Christmas gift spending by over $100. A 2024 survey revealed that US citizens expected to spend an average of $1,012 on Christmas shopping, which is $110 more than the average actually spent during that holiday season, according to money-central.com.
The lowest expected Christmas gift spending of the 21st century occurred in 2008 ($616) and 2009 ($638).
 bar chart showing Christmas gift spending
Here’s a closer look at the figures:
| Year | Personal Christmas Gift Spending Estimate (Gallup) | Personal Christmas Gift Spending (NRF) |
|---|---|---|
| 2006 | $826 | $907 |
| 2007 | $866 | $909 |
| 2008 | $616 | $801 |
| 2009 | $638 | $740 |
| 2010 | $714 | $715 |
| 2011 | $764 | $712 |
| 2012 | $770 | – |
| 2013 | $704 | $786 |
| 2014 | $720 | $781 |
| 2015 | $830 | $812 |
| 2016 | $752 | $796 |
| 2017 | $862 | $826 |
| 2018 | $794 | $853 |
| 2019 | $846 | $886 |
| 2020 | $852 | $880 |
| 2021 | $886 | $879 |
| 2022 | $867 | $833 |
| 2023 | $975 | $875 |
| 2024 | $1,012 | $902 |
The NRF’s 2024 Christmas spending projection of $902 is the highest in over a decade, and similarly, Gallup’s 2024 figure of $1,012 is a new record, according to money-central.com.
5. US Christmas Non-Gift Spending Over Time
How much is spent on non-gift christmas expenses? Americans spend an average of $507 on non-gift Christmas expenses each year, with non-gift spending on the rise, reaching an estimated $735 in 2024 when combined with experiences, according to money-central.com.
 graphic stating average non-gift holiday spend
The evolution of spending since 2019 is shown below:
| Year | Gifts | Non-Gifts | Experiences | Total |
|---|---|---|---|---|
| Spend | Change | Spend | Change | |
| 2019 | $511 | – | $389 | – |
| 2020 | $487 | ↓ 4.7% | $435 | ↑ 11.8% |
| 2021 | $501 | ↑ 2.9% | $425 | ↓ 2.3% |
| 2022 | $507 | ↑ 1.2% | $373 | ↓ 12.2% |
| 2023 | $554 | ↑ 9.3% | $466 | ↑ 24.9% |
| 2024 | $536 | ↓ 3.2% | $507 | ↑ 8.8% |
The average spend on non-gifts during the Christmas period has increased by $118 since 2019 ($389), demonstrating a shift towards prioritizing experiences and seasonal items, according to money-central.com.
6. Average Christmas Spending Around the World
How does US spending compare globally? The average Christmas spending in the United States is $1,205 per year, according to WorldRemit data. However, Canadians spend over $500 more, averaging $1,717 each year. Despite this, the US allocates the second-highest proportion of Christmas money to gifts (69%), trailing only the UK (70%), as reported by money-central.com.
Filipinos allocate 60% of their Christmas money to food, while Colombians spend just 10%, similar to the US’s 12%. Americans spend 19% of their holiday budget on decorations, whereas Dominicans allocate 80% to festive decor, according to money-central.com.
 bar chart showing average Christmas spending around the world
A detailed breakdown of data from 24 selected countries, ranked by average total spending, shows:
| Rank | Country | Average Total Spent 2022 | Average Total Spent 2023 | Change Over Previous Year | Food | Decorations | Gifts |
|---|---|---|---|---|---|---|---|
| $ | $ | % | $ | % | $ | ||
| 1 | Canada | $2,100 | $1,717 | ↓ 18.2% | $395 | 23% | 445 |
| 2 | Germany | $1,453 | $1,653 | ↑ 13.8% | $276 | 17% | $275 |
| 3 | US | $1,236 | $1,205 | ↓ 2.5% | $147 | 12% | $231 |
| 4 | France | $1,127 | $1,142 | ↑ 1.3% | $124 | 11% | $269 |
| 5 | Australia | $1,077 | $1,118 | ↑ 3.8% | $380 | 32% | $284 |
| 6 | Mexico | $1,076 | $1,055 | ↓ 2% | $167 | 16% | $343 |
| 7 | UK | $1,075 | $1,042 | ↓ 3.1% | $121 | 12% | $193 |
| 8 | Italy | – | $841 | – | $169 | 20% | $243 |
| 9 | Spain | $499 | $742 | ↑ 48.7% | $284 | 38% | $109 |
| 10 | Netherlands | $679 | $657 | ↓ 3.2% | $194 | 30% | $136 |
| 11 | Cameroon | $612 | $650 | ↑ 6.2% | $220 | 34% | $333 |
| 12 | Philippines | $569 | $614 | ↑ 7.9% | $366 | 60% | $42 |
| 13 | Guatemala | $315 | $324 | ↑ 2.9% | $36 | 11% | $209 |
| 14 | Fiji | $290 | $278 | ↓ 4.1% | $36 | 13% | $163 |
| 15 | Zimbabwe | $209 | $254 | ↑ 21.5% | $55 | 22% | $94 |
| 16 | Rwanda | $258 | $239 | ↓ 7.4% | $78 | 32% | $80 |
| 17 | Nigeria | $309 | $218 | ↓ 29.4% | $114 | 52% | $68 |
| 18 | Kenya | $212 | $215 | ↑ 1.4% | $46 | 21% | $49 |
| 19 | Dominican Republic | $179 | $208 | ↑ 16.2% | $22 | 11% | $167 |
| 20 | Colombia | $272 | $198 | ↓ 27.2% | $19 | 10% | $97 |
| 21 | South Africa | $172 | $166 | ↓ 3.5% | $43 | 26% | $59 |
| 22 | India | $139 | $146 | ↑ 5% | $58 | 40% | $40 |
| 23 | Nepal | – | $86 | – | $43 | 50% | $20 |
| 24 | Uganda | $60 | $64 | ↑ 6.7% | $36 | 56% | $13 |
The percentage of average household income spent on Christmas also varies significantly:
| Rank | Country | Average Household Income | Average Total Spent | Percentage of Average Household Income Spent |
|---|---|---|---|---|
| 1 | Cameroon | $8,830 | $650 | 7.4% |
| 2 | Philippines | $9,430 | $614 | 6.5% |
| 3 | Dominican Republic | $4,206 | $208 | 4.9% |
| 4 | Mexico | $22,106 | $1,055 | 4.8% |
| 5 | Nigeria | $5,288 | $218 | 4.1% |
| =6 | Canada | $49,446 | $1,717 | 3.5% |
| =6 | Zimbabwe | $7,212 | $254 | 3.5% |
| =6 | Rwanda | $6,810 | $239 | 3.5% |
| 9 | Germany | $58,853 | $1,653 | 2.8% |
| 10 | France | $52,686 | $1,142 | 2.2% |
| 11 | Guatemala | $16,307 | $324 | 2% |
| =12 | Australia | $59,973 | $1,118 | 1.9% |
| =12 | UK | $53,901 | $1,042 | 1.9% |
| =12 | Italy | $44,827 | $841 | 1.9% |
| 15 | Kenya | $11,651 | $215 | 1.8% |
| 16 | Spain | $42,796 | $742 | 1.7% |
| 17 | US | $77,463 | $1,205 | 1.6% |
| 18 | Colombia | $13,560 | $198 | 1.5% |
| 19 | Nepal | $7,290 | $86 | 1.2% |
| =20 | Netherlands | $62,133 | $657 | 1.1% |
| =20 | Fiji | $25,118 | $278 | 1.1% |
| 22 | Uganda | $9,029 | $64 | 0.7% |
| =23 | South Africa | $19,950 | $166 | 0.1% |
| =23 | India | $24,887 | $146 | 0.1% |
The US spends a relatively low proportion of household income on Christmas shopping, at under 2%, according to money-central.com.
7. US Christmas Spend by Demographic
How does spending vary based on demographic factors in the US? Christmas spending in the US varies significantly based on gender, age, and region, providing insights into diverse consumer behaviors.
-
US Christmas Spend by Gender
Expense Proportion of Men Proportion of Women Difference Gifts for family